- Download PDF
Executive Summary
Prevailing wages govern what employers must pay foreign workers. Earlier today, DOL published a Notice of Proposed Rulemaking (NPRM) revising how it determines prevailing wages for numerous employment-based visa programs, including the H-1B and most employment-based green cards.1
The proposed rule considers two different ways to reform the prevailing wage system, each intended to prevent employers from using visas to undercut the wages of American workers: a “Blind Benchmarking” approach and an “Experience Benchmarking” approach. In this analysis, we show that the Department’s main proposal, Blind Benchmarking, cannot end “wage arbitrage,” the practice of employers using visa programs to pay foreign workers less than similarly qualified Americans. We also show that if the Department were to adopt Experience Benchmarking instead, it would permanently end employers’ ability to get visas for foreign workers who they will pay less than similarly qualified Americans.
Key findings:
- Most H-1B workers (53.6%) earn less than the median wage paid to native-born workers with the same occupation, area of employment, experience, and education. Underpayment is particularly acute among H-1B-dependent employers, in the custom computer programming industry.
- Blind Benchmarking, DOL’s primary proposal, doesn’t deliver on its stated goals.
- 30.8% of the time, it incorrectly identifies whether an H-1B worker earns a positive or negative wage premium.
- Had the new NPRM been in place from 2022-2024, 17.2% of new capped H-1Bs would have gone to employers paying less than the median for comparable natives.
- Experience Benchmarking, DOL’s alternative proposal, would eliminate any employer’s ability to sponsor foreign workers for less than the typical American with the same qualifications. Had it been in place from FY2022-2024, the median wage paid to initial cap-subject H-1Bs would have been higher by $17,000- $22,000 each year.
DOL’s primary proposal: Blind Benchmarking
DOL’s main proposal maintains its longstanding method of setting prevailing wages based on a comparison of job requirements to a set of uniform percentiles of surveyed wages. DOL’s primary proposal revises these uniform percentiles by simply raising the existing prevailing wage thresholds for Levels I-IV from the 17th, 34th, 50th, and 67th occupational earnings percentiles to the 34th, 52nd, 70th, and 88th percentiles respectively.
This approach is “blind” in two senses: First, it is blind to the actual foreign worker’s qualifications because its prevailing wages are grounded in the employers’ self-reported job requirements. This allows employers to game the system by strategically getting lower prevailing wage requirements than the market rate commanded by Americans with similar qualifications to the specific foreign worker being sponsored. Second, it sets prevailing wage levels with an underlying dataset that is blind to what Americans actually earn at different levels of experience and education. These limitations are inherited from DOL’s reliance on the Occupational Employment and Wage Statistics (OEWS) data, which lacks information on earnings by education and experience.
Blind Benchmarking is fundamentally unable to fulfill its goal of directly comparing the pay of foreign workers to the pay of American workers with the same qualifications. This makes it impossible to determine whether workers being sponsored for a visa are potentially undercutting American workers.
DOL’s alternative proposal: Experience Benchmarking
DOL’s second proposal considers a new alternative called “Experience Benchmarking” that benchmarks the wages employers have to pay foreign workers against the median wages actually earned by Americans with the same occupation, area of employment, level of education, and experience. Rather than trusting job descriptions, it requires employers to confirm the specific foreign worker’s actual qualifications as the basis for the prevailing wages an employer must pay. It also supplements OEWS data with American Community Survey (ACS) data on what US workers make at different levels of education and experience. The result is that Experience Benchmarking would allow firms to sponsor foreign workers only if they pay at least what the typical American with the same occupation, area of employment, level of education, and experience actually earns.
This analysis uses FOIA data on new cap-subject H-1Bs from FY2022-2024 to see how DOL’s Blind Benchmarking proposal and new Experience Benchmarking proposal would each classify the same workers.
In the new NPRM, the Department explains the promise of Experience Benchmarking:
First, the [Experience Benchmarking] proposal essentially ends the practice of wage arbitrage which improves the standing of American workers and the benefits that flow from strong middle-class employment. Second, the proposal substantially improves the ability of the visa programs to screen for exceptional talent and ability. Third, the proposal reduces the ability of employers to under classify workers using strategic job descriptions.2
I. Flying blind
The mission of prevailing wages
Prevailing wages are supposed to ensure that employers cannot use visa programs like the H-1B or employment-based green cards to undercut American workers. In its NPRM, DOL proposes to change how it calculates prevailing wages for the H-1B, the largest visa program for admission of new, foreign-born professionals each year, the H-1B1, E-3, and most employment-based green cards (most immigrants in the EB-2 and EB-3 categories).
In the NPRM, DOL states that its role in the immigration system is “to ensure that the introduction of foreign labor into the United States supplements, rather than displaces, U.S. workers.” The principal way DOL does this is by setting prevailing wages that govern what employers must pay foreign workers on various visa programs and those who they sponsor for permanent residency. When petitioning for or sponsoring a foreign worker, federal law requires firms to pay at least the actual wages they pay comparable US workers or the prevailing wage for the occupation and location. This law is designed to ensure that immigration does not undercut American workers.3
But good intentions are not sufficient to protect American workers. Many have simply assumed that the prevailing system works and ignored or never evaluated its shortcomings. For example, in a Cato Institute report, David Bier claims that “100 percent of H‑1B employers offer H‑1Bs at least the average prevailing market wage for similar U.S. workers.”4 The evidence he offers is simply that the law requires employers to “offer their foreign workers the average prevailing wage in the occupation for the relevant skill level,” taking on faith that the prevailing wage system is working as Congress intended.5 But the truth is that it is not working as intended.
Blind Benchmarking is simply not capable of actually comparing H-1B workers (or any foreign workers) against similar US workers. We find that despite the current prevailing wage requirements, less than half (46.4%) of initial cap-subject H-1Bs go to foreign workers who are paid equal to or more than comparable natives.
How DOL sets prevailing wages today, and where they fall short
Since 1990, H-1B workers have been subject to prevailing wage requirements. Starting in 1997, DOL concluded that “the most efficient and cost effective way to develop consistently accurate prevailing wage rates” is by using earnings data from the Occupational Employment and Wage Statistics (OEWS) program at the Bureau of Labor Statistics (BLS).6 Congress last acted to amend the controlling prevailing wage statute in 2004, requiring that wage levels be commensurate with levels of education, experience, and supervision.7
In order to meet the new congressional mandate that prevailing wages be commensurate with education and experience, DOL defined four OEWS “skill levels:”
- Level I: “Entry Level”
- Level II: “Qualified”
- Level III: “Experienced”
- Level IV: “Fully competent”
However, DOL did not base their definitions on any data about what American workers get paid for two reasons. DOL does not require employers to provide information about the credentials of the particular workers they are sponsoring as part of the prevailing wage determination process. In addition, the underlying data from OEWS does not provide information on education or experience.
As the Center for Immigration Studies has aptly said, the ”published descriptions for these skill levels…are entirely fictions that have no statistical relationship to the actual data” on worker qualifications.8 In practice, this has made prevailing wage levels, in the words of economist George Borjas, “a very poor proxy for skills” because the “prevailing wage levels reported by employers in the LCA have little to do with the tangible skills embodied in the foreign-born workforce.”9
Employers are instructed to evaluate their own job requirements against the typical requirements for the job provided by DOL to determine whether their job is categorized as either Level I, II, III, or IV. Then, the prevailing wage for that job is set at four fixed thresholds in the earnings distribution for that occupation and area. These benchmarks are reflected in fixed percentiles for each Level, uniform across every occupation.
Level I jobs are required to pay foreign workers subject to prevailing wage rules at least the 17th percentile of earnings for their occupation and area of employment; Level II is set at the 34th percentile; Level III at the 50th percentile; and Level IV is set at the 67th percentile. These same percentiles apply in every occupation in the US labor market and are computed by the Office of Foreign Labor Certification (OFLC) at DOL. They are based on special tabulations from the OEWS obtained from the Bureau of Labor Statistics (BLS).
Blind Benchmarking inherits the problems of the status quo
Under the 2026 NPRM’s primary proposal, DOL retains this preexisting uniform-percentiles structure and associated definitions and merely changes these percentile cutoffs. Level I would be raised from the 17th percentile to the 34th, Level II from the 34th to the 52nd, Level III from the 50th to the 70th, and Level IV from the 67th to the 88th.
In other words, while the NPRM’s primary proposal includes changes to its particular choice of benchmarks, it preserves two basic problems of its longstanding approach that threaten its ability to protect US workers. We characterize the two features of this longstanding approach as “Blind Benchmarking.”
First, Blind Benchmarking computes prevailing wage requirements based solely on an employer’s own description of the minimum job requirements rather than information about the particular foreign worker being sponsored. In the H-1B Labor Condition Application (LCA) process, this allows employers to minimize their wage obligations by strategically characterizing positions as Level I and Level II regardless of the beneficiary’s actual qualifications. The Economic Policy Institute has documented large “discrepancies between the skill levels reported on LCAs and the experience and education levels for actual workers approved on those LCAs.”10 These discrepancies are an intrinsic feature of Blind Benchmarking.
Second, Blind Benchmarking relies exclusively on OEWS data that contain no actual data on earnings by experience or education. In other words, Blind Benchmarking does not have the information required to identify what “comparably qualified” Americans actually earn, and therefore cannot support DOL in making apples-to-apples comparisons between foreign workers and their native counterparts. By construction, Blind Benchmarking will always create opportunities for employers to use visas to engage in wage arbitrage, regardless of how high the Department of Labor sets its four uniform wage percentile thresholds.
These data limitations have compelled DOL to assume, contrary to evidence, that all occupations have exactly the same distribution of experience, education, and skills. But occupations differ in how their workforces are distributed across experience levels: Some occupations are more “junior-heavy” with more entry-level staff relative to senior staff; others are “senior-heavy” with relatively more experienced staff. Nevertheless, Blind Benchmarking applies the same percentile cutoffs to every occupation. And if DOL sets the percentile thresholds so they are more appropriate to senior-heavy occupations, then junior-heavy occupations can unfairly use the immigration system for wage arbitrage, undercutting US workers, while still successfully satisfying labor certifications.
In short, Blind Benchmarking can’t tell why a worker earns what they earn, leaving the Department to simply guess what “entry-level,” “qualified,” “experienced,” and “fully competent” workers earn in the labor market. Blind Benchmarking changes those guesses, but guesses they remain. It is fundamentally impossible to use Blind Benchmarking to distinguish between a worker who earns a premium for contributing rare, valuable skills from another worker who is simply far along in their career. For that, it would need data on earnings by education and experience and information about the qualifications of the particular foreign workers being sponsored.
In Section III, we explore more about how Blind Benchmarking (under both the status quo and as revised in the 2026 NPRM) fails to prevent wage arbitrage and fails to block employers from sponsoring foreign workers while paying less than comparable natives. But first, we describe Experience Benchmarking, a novel alternative that DOL is also considering in this NPRM, designed to address the shortcomings of Blind Benchmarking.
II. Experience Benchmarking
In addition to DOL’s primary proposal that retains Blind Benchmarking (but revises the particular percentile benchmarks), DOL is also considering an alternative that could replace Blind Benchmarking altogether. This novel alternative, “Experience Benchmarking,” is intended to address the limitations of Blind Benchmarking by directly benchmarking the earnings of foreign workers against the median wages of native workers with the same occupation, area of employment, education, and experience.
Here is how DOL describes Experience Benchmarking:
The Department also seeks public comment on an alternative approach to revising prevailing wage levels using a methodology called Experience Benchmarking. …The Department is considering this alternative to potentially improve the comparison of the wages of foreign workers to those of similarly qualified U.S. workers. As noted previously under the current rule, prevailing wage levels are derived from the overall wage distribution within an occupation and geographic area and are applied based on the employer’s description of the minimum job requirements for the position. Because the underlying OEWS data do not collect information on worker education or experience, the methodology employed under the current rule may allow positions to be classified at wage levels that are less comparable to the actual education and experience of the foreign worker. As a result, a worker with significantly higher education or professional experience could be paid a wage benchmarked to U.S. workers with comparably lower levels of education and experience. Experience Benchmarking seeks to address this limitation by comparing the sponsored worker’s wage to the wages earned by U.S. workers with comparable education and experience in the same occupation and geographic area, thereby producing prevailing wages that more closely reflect the wages paid to similarly qualified workers in the U.S. labor market.11
Experience Benchmarking ensures apples-to-apples comparisons every time. It asks the question required to fulfill its congressional mandate: “How much does the median American with the same qualifications in the same occupation and area actually earn?”
Under Experience Benchmarking, any employer trying to make an initial hire of a foreign worker — in any sector or geography, whether cap-exempt or cap-subject — will have to pay more than the salary of that median comparable American if they want to get an H-1B, H-1B1, or E-3.
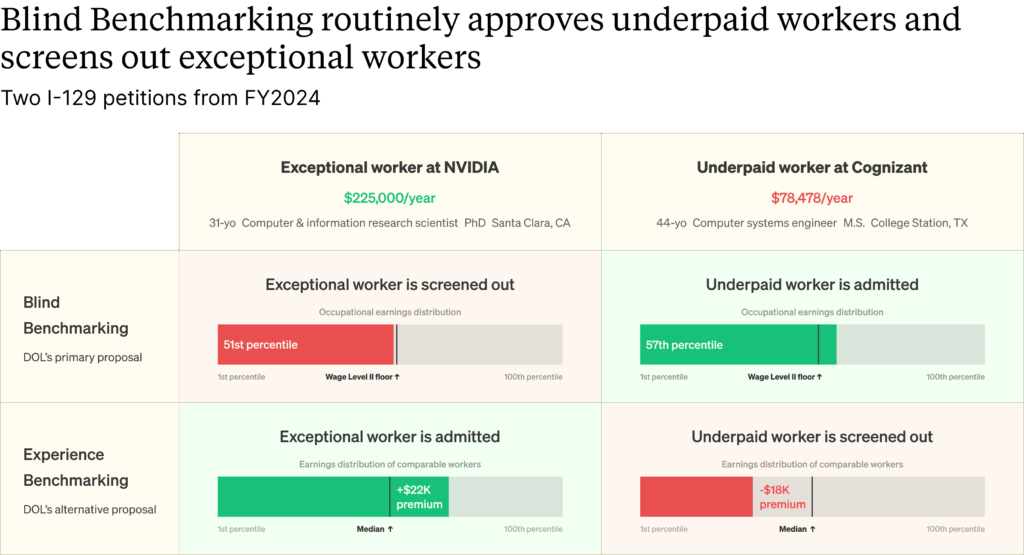
Let’s consider a real-world example, taken from historical H-1B data. Two petitions from FY2024 illustrate both the logic of Experience Benchmarking and the failure modes of Blind Benchmarking.
In FY2024, NVIDIA petitioned for an H-1B on behalf of a 31-year-old computer science PhD to work as a Level II computer and information research scientist in Santa Clara, California. NVIDIA offered a salary of $225,000. Under Experience Benchmarking, this worker clears the bar easily: his salary is $22,581 above the median 31-year-old native-born PhD computer and information research scientist in the San Jose metropolitan area.12 The NVIDIA engineer represents exactly the kind of foreign worker the H-1B program is supposed to admit: someone offering rare and valuable skills for which employers pay a genuine premium.
That same year, the IT outsourcer Cognizant petitioned for an H-1B on behalf of a 44-year-old with a master’s degree to work as a computer systems engineer in College Station, Texas. Cognizant offered a salary of $78,478 per year. Despite being filed as a Level II petition, the worker would earn $17,514 less than the typical 44-year-old with a master’s degree working as a computer systems engineer in the College Station-Bryan metro area.13 The Cognizant worker represents the opposite of what the H-1B program should encourage: an employer using the visa system to sponsor a foreign worker at below-market wages.
Now observe how the NPRM’s primary proposal, Blind Benchmarking with raised percentiles, handles these two cases. Blind Benchmarking approves and denies the wrong workers!
Because Blind Benchmarking cannot observe beneficiary credentials and benchmarks wages against the entire occupational distribution, it systematically confuses the two workers:
- The NVIDIA scientist earns $22,581 more than the comparably qualified American, but he sits below the new Blind Benchmarking threshold of the 52nd percentile for a Level II job. This is a false negative. Had the NPRM’s revised Blind Benchmarking standard been in place, DOL would have denied the LCA filed on his behalf.
- The Cognizant engineer earns $17,514 less than a comparably qualified American, but easily passes the updated Blind Benchmarking test, given that his pay is at the 57th percentile for his occupation and area. This is a false positive. The prevailing wage system should flag this worker and lead to a denial. Instead, the LCA sails through.
Even with DOL’s proposed new percentiles, Blind Benchmarking catches the wrong worker and misses the right one.
When tested against new cap-subject H-1Bs from FY2022-2024, DOL’s revised Blind Benchmarking gets cases wrong 30.8% of the time.
We define a policy’s “accuracy rate” as the share of H-1B petitions that it correctly classifies. By this measure, we can calculate precisely how common these “misses” are, when a policy admits a worker who earns less than similarly qualified Americans (a false positive) or denies a worker who genuinely earns a positive wage premium over similarly qualified Americans (a false negative).
Status quo Blind Benchmarking gets a failing grade, with an accuracy rate from FY2022-2024 of only 46.4%.14 Although the NPRM’s new version of Blind Benchmarking does better, it only scores an accuracy rate of 69.2%. Fully 17.2% of H-1Bs would still be underpaid under the NPRM’s Blind Benchmarking proposal.
Experience Benchmarking, by construction, has an accuracy rate of 100%. That is because Experience Benchmarking directly sets the prevailing wage at the median for comparably qualified native-born workers. No employer is allowed to get an H-1B, H-1B1, or E-3 if they are sponsoring a worker with a negative wage gap.
How would Experience Benchmarking actually calculate prevailing wages?
Experience Benchmarking sets prevailing wages the way labor economists actually estimate earnings. The core tool is the Mincer earnings function, a workhorse economics model introduced by Jacob Mincer in 1974, which models the log of wages as a function of education and potential labor market experience (typically measured as age minus years of schooling minus six). It is, by any measure, one of the most widely used models in empirical economics. Standard textbooks describe the Mincer-style regression as the approach used by “the typical study” estimating earnings, with hundreds of published applications estimating returns to schooling using this framework.15
The intuition behind the Mincer function is straightforward: workers with more education and more experience command higher wages, and the returns to each follow predictable patterns that can be estimated from survey data. Experience Benchmarking uses the ACS to fit unique Mincer equations for each occupation to capture different returns to education and experience that may vary across occupations. Those fitted equations can be used to produce a matrix of expected earnings for every combination of education and experience.
This matrix is then used to adjust occupational earnings from the OEWS that OFLC receives from BLS. In this way, Experience Benchmarking draws on the relative advantages of both ACS and OEWS: ACS contains information on earnings by education and experience that is missing from the OEWS, but OEWS has better and more reliable coverage across all the geographies and occupations necessary for prevailing wage calculations. DOL’s Experience Benchmarking proposal does a good job of using each where its relative strengths lie.16
BLS already applies a very similar methodology in its other work: Although this technique was not used by BLS when DOL began to calculate prevailing wages, the labor productivity group within BLS’s Division of Industry and Productivity Statistics has since begun to use ACS microdata to estimate how wages vary with education and experience within granular industry-occupation cells, as part of constructing quality-adjusted labor input measures for Total Factor Productivity estimates. They do this in the exact same way DOL proposes to do under Experience Benchmarking. In short, Experience Benchmarking would bring the standard methodology from labor economics (and already deployed within DOL at BLS) into prevailing wage determinations, improving both the accuracy and integrity of the system, and significantly cutting down on the ability of employers to use foreign workers for wage arbitrage.
A new definition of OEWS Wage Levels
Beyond improving accuracy and integrity, Experience Benchmarking is assigning new meaning to the four Skill Levels.
Under Blind Benchmarking, the four wage levels are supposed to sort workers into four skill levels by experience and education: “entry level,” “qualified,” “experienced,” and “fully competent” jobs. But as we have seen, they cannot actually do this, because DOL neither collects data on beneficiary credentials nor uses data on earnings by experience and education. The four levels are therefore attempting to capture variation in experience and education using percentiles of the overall occupational distribution. But they are little more than educated guesses of what workers with different combinations of experience and education actually earn.
Experience Benchmarking eliminates the need to use these levels as proxies for unobserved qualifications: Education and experience are already built directly and explicitly into the wage floor, setting each worker’s prevailing wage (Level I) as what the median native-born worker with the same education and experience typically earns (in the same occupation and area). The four wage levels aren’t obsolete, however — they are freed to do something more useful.
Under Experience Benchmarking, the four wage levels break down into “Typical,” “Specialized,” “Demanding,” and “Highly Demanding.” Among workers with the same credentials, these categories represent residual wage variation attributable to the complexity of the particular position, the degree of supervision, and the level of specialized skills demanded by the specific job, given a constant level of education and experience. In other words, Skill Level becomes a measure of where a job falls in the wage distribution within a peer group of workers with comparable qualifications: A Level I job is a typical job for someone with a given background and is thus the prevailing wage (i.e. the median for natives in the occupation, area, education, and experience). A Level IV job is one that commands a very high premium even relative to others with the same education and experience (i.e., the 90th percentile for natives in the occupation, area, education, and experience).
This is a substantively different conception of what wage levels signify. These new definitions of wage levels (“Typical,” “Specialized,” “Demanding,” and “Highly Demanding”) are not only more accurate than the crude proxies for worker seniority under Blind Benchmarking, but they also better serve the purposes of the H-1B system. Under the weighted lottery, which awards more entries to workers with offered wages at higher OEWS wage levels, Experience Benchmarking therefore prioritizes visas for candidates who offer truly rare, exceptional, and valuable skillsets as evidenced by higher wage premia.
III. Comparing H-1Bs to US natives
In this section, we investigate where underpayment is prevalent in the H-1B system. We also find that Blind Benchmarking does a poor job of identifying and rooting it out.
Our analysis draws on three primary sources. Data on initial cap-subject H-1B workers comes from historic I-129 petition data from USCIS, obtained by Bloomberg for fiscal years 2022, 2023, and 2024, providing geographic, occupational, and salary characteristics for each petition. Data on US workers draws from two sources, ACS data and OFLC prevailing wage data (itself computed from OEWS data). Data on how wages vary with education and experience among native-born US workers come from publicly available American Community Survey microdata. These ACS estimates are used to adjust OFLC prevailing wage data up or down based on different combinations of experience and education.
While this analysis uses existing OFLC-produced prevailing wage data, the Department of Labor would implement Experience Benchmarking (like it implements any prevailing wage system) using OEWS data received by OFLC from BLS as a special tabulation.
Our methodology proceeds in three basic steps, as follows:
First, we estimate where each H-1B petition falls on its local occupation-area earnings distribution, assigning a percentile analogous to those under Blind Benchmarking.
Next, we fit occupation-specific Mincer equations to ACS data to predict earnings as a function of education and experience within each occupation. We then benchmark those predicted earnings to OFLC occupational medians for specific areas, which allows us to directly compare salaries on I-129 petitions with those of similarly qualified American workers, and thereby identify which H-1B workers are underpaid.
Finally, these petitions are used to simulate rates of underpayment under alternative prevailing wage policies.
We go into much greater detail on the methodology in the Appendix.
Not all H-1B employers are equally implicated in wage arbitrage. The data reveal a stark divide between H-1B-dependent employers — those for whom H-1B workers comprise a significant share of the workforce, typically IT outsourcing and staffing firms — and all other employers.As the chart above shows, the typical non-H-1B-dependent employer actually pays its H-1B workers a modest positive premium relative to similarly qualified Americans: a median wage premium of +2.8%. By contrast, the median H-1B worker at an H-1B-dependent employer earns 9.9% less than a similarly qualified American in the same occupation and labor market. And while 46.3% of H-1B workers at non-dependent employers are underpaid relative to comparable Americans, that figure rises to 67.0% at H-1B-dependent firms. Among H-1B-dependent employers, the accuracy rate of the 2026 Blind Benchmarking proposal is only 74.5%.
Blind Benchmarking is also particularly bad at handling H-1Bs filed on behalf of graduates from US universities compared to others. This could be particularly detrimental to the national interest given evidence that foreign workers who first enter the United States as F-1 students are more innovative and entrepreneurial than other immigrants with college degrees.17 Among H-1Bs filed on behalf of F-1 students, the underpayment rate is 32% less than among all other H-1Bs. Importantly, the 59.5% of F-1s turned H-1Bs with positive wage premia are disproportionately likely to be false negatives and blocked under DOL’s primary Blind Benchmarking proposal.
Underpayment also varies significantly by industry and occupation. For example, the industries with the most underpayment (and at least 1,000 H-1B petitions in fiscal years 2022-24), are custom computer programming services (78% underpaid), other computer related services (68% underpaid), and engineering services (66% underpaid). By contrast, other industries have very low rates of underpayment, including management, scientific, and technical consulting services (12% underpaid), electronic computer manufacturing (14% underpaid), and automobile manufacturing (20% underpaid).
The success of Blind Benchmarking in handling these varies widely. In some occupations, like computer systems analysts (80% accuracy rate) and lawyers (76% accuracy rate), the NPRM’s Blind Benchmarking approach correctly identifies whether workers are underpaid most of the time. But in other occupations like architects (44% accuracy rate), web developers (45% accuracy rate), and chemical engineers (49% accuracy rate), Blind Benchmarking is incorrect a majority of the time.
We can visualize the inaccuracy of the NPRM’s Blind Benchmarking proposal. In the chart below, each dot represents an initial cap-subject H-1B filed in FY2024 for which DOL’s Blind Benchmarking proposal would fail to correctly identify whether the worker earns more or less than comparable Americans. Each red dot represents a “false negative,” an H-1B worker who earns more than similarly qualified Americans but who would nevertheless be excluded by DOL’s main proposal. Each green dot represents a “false positive,” an H-1B worker who earns less than similarly qualified Americans but who would still be eligible for a visa under DOL’s proposal.
In short, we know beyond any doubt that Blind Benchmarking will result in many highly-paid workers earning high premiums being made ineligible for visas and many low-paid workers earning less than similar Americans remaining eligible. Under Experience Benchmarking, this would not be the case.
Conclusion
The Department of Labor gave itself a choice in this rulemaking: should it finalize Experience Benchmarking and end wage arbitrage or continue to set prevailing wages with a Blind Benchmarking methodology that, despite its familiarity, is fundamentally incapable of doing what Congress intended?
DOL’s primary proposal, Blind Benchmarking with higher uniform percentiles, does not resolve the structural problem with prevailing wages. It changes the numbers without taking off the blindfold. An accuracy rate of 69.2% means that about one in three petitions is misclassified: exceptional workers turned away, arbitrage-driven hires waved through. 17.2% of the H-1Bs that would remain eligible under the NPRM’s primary proposal would still go to employers paying less than the median for comparably qualified Americans.
Experience Benchmarking resolves these failures at their source. By requiring employers to document actual beneficiary credentials rather than minimum job requirements, and by anchoring wage floors to what native-born Americans with those specific credentials actually earn, Experience Benchmarking eliminates both the gaming and the guesswork. Had it been in place from FY2022 through FY2024, the median wage paid to initial cap-subject H-1Bs would have been $17,000 to $22,000 higher per year. Employers seeking to use the H-1B system for wage arbitrage would have found that avenue closed.
Congress required in 2004 that prevailing wages be commensurate with education and experience. After nearly three decades relying on a dataset that contains no information about any of those things, DOL is now actively considering a methodology that delivers on that mandate. After long flying blind, with more than half of H-1B workers underpaid as a result, DOL finally has the instruments it needs to fulfill its mandate. Why is it considering ignoring them?
Appendix 1: Legal History of Prevailing Wages
The US immigration system relies on identifying prevailing wages to protect the integrity of employment-based visa programs. Prevailing wage determinations are the linchpin in satisfying the statutory requirement that employers pay immigrants at least the actual wages they pay other similar US workers and the prevailing wages for the occupation in the place of employment, and that such wage levels are commensurate with experience and education.
The Immigration and Nationality Act (INA) currently provides that a default requirement for foreign-born workers seeking employment-based green cards and numerically-limited employer-sponsored nonimmigrant worker visas is a DOL prevailing wage determination. This focus on “prevailing wages” has long been a feature of US immigration law, starting a century ago.
In the 1917 immigration statute, contracted agricultural workers were specifically barred from entry to the US, but the Commissioner of Immigration and Secretary of Labor were also specifically authorized to admit otherwise inadmissible persons.18 After the US entered World War I, the Department of Labor exercised this authority to allow Mexican Braceros to work for farmers in the western US when, among other conditions, wages offered were the same paid for similar labor in the community in which the Mexicans were to be employed. This same wage concept was also featured when the Bracero Program was re-initiated during World War II, with a mandate that the Department of Agriculture administer the program and that there be an annual “prevailing wage” determined at the beginning of the growing season based on the locality in which the labor was to be provided.19
The statutory construct governing US immigration, the INA, was enacted in 1952 and, while subject to several overhauls and major revisions in the intervening 75 years, all revisions to the nation’s immigration law have amended this same statute. Many artifacts of today’s immigration system still harken back to the INA’s original construct and the role of federal agencies in that construct. The INA did not initially, or for decades, provide any congressional mandates about the nature of prevailing wages. Instead, the Department of Labor issued and revised policy-level guidance on required wage constructs for the hire of noncitizen workers in agriculture and beyond, even before the INA specifically talked about “prevailing wages.” In 1977, DOL codified its own binding regulation instituting an agency definition for required prevailing wage determinations underlying permanent employment certification necessary for most employment-based permanent residents. DOL’s regulation established that the prevailing wage owed to a foreign worker being sponsored for green card status was “the average rate of wages” paid to those workers “filling jobs requiring a substantially similar level of skills,” with the average “to be determined, to the extent feasible, by adding the wage paid to workers similarly employed in the area of intended employment and dividing the total by the number of such workers. Since it is not always feasible to determine such an average rate of wages with exact precision, the wage set forth in the application shall be considered as meeting the prevailing wage standard if it is within 5 percent of the average rate of wages.”20
It was so well-understood that federal agencies had experience validating prevailing wages that imposing a prevailing wage mandate on the H-1B classification in the Immigration Act of 1990 did not initially come with any statutory language delineating such wage confirmation.21 Indeed, prevailing wage guidance from DOL following implementation of IMMACT90 made clear that the prevailing wage determination could be based on a survey conducted by a state agency or by any published survey that was specific enough to the occupation and locale, with the idea that published, publicly available surveys were preferred.22 Later, in 1997, DOL concluded that “the most efficient and cost effective way to develop consistently accurate prevailing wage rates is to use the wage component of the BLS Occupational Employment Statistics (OES) program.”23 Thus, by agency action, relying on BLS data became the primary means to establish prevailing wages.
It was only in 1998 that Congress acted to add Section 212(p) to the INA, governing the computation of prevailing wage levels for H-1B, H-2B, and permanent labor certification by statute.24 But even then, agency action controlled the prevailing wage determinations, establishing by DOL policy that prevailing wages issued for H-1B and permanent labor certifications programs identified two wage levels based on OES survey results with the Level 1 utilized for what DOL described as beginning level employees that performed routine or moderately complex tasks and the Level 2 for fully competent employees that used advanced skills.25 Congress last acted to amend the controlling prevailing wage statute in 2004, adding mandates that employers pay 100% of the prevailing wage determined, that wage levels be commensurate with levels of education, experience, and supervision, and that at least 4 wage levels be provided by the government.26
In other words, the current provisions of the governing statute are best understood as a response to and a reflection of the much longer record of agency action attempting to consider and operationalize the concept of a “prevailing wage.” With modern data sources and data analysis capabilities, DOL is uniquely positioned to update the prevailing wage calculation to better protect American workers, improve the integrity of the nation’s immigration system, and prioritize the admission of immigrants who will make the largest contributions to the U.S. economy.
Appendix 2: Methodology
In this section, we explain how we estimate rates of H-1B underpayment under the current prevailing wage system and under the Department of Labor’s proposed Blind Benchmarking reform.
Step 1: Assigning occupation/area-specific percentiles to publicly available H-1B data.
In order to simulate how different thresholds in a future DOL prevailing wage rule would change rates of underpayment in the H-1B program, we need to tag H-1B petitions in our Bloomberg dataset with an earnings percentile specific to their occupation and labor market area. Combined with the OFLC-assigned wage level of each petition, we can determine whether any petition in our dataset — which encompasses H-1B lottery winners from fiscal years 2022 through 2024 — would have been eligible or ineligible under today’s proposal from DOL.
First, we estimate where each H-1B petition in the USCIS dataset falls within the earnings distribution for the relevant labor market and occupation. H-1B petitions are matched by year, area, and occupation with OFLC wage levels made public on the Department’s website. The beneficiary’s salary listed on the I-129 can then be compared to the petition’s relevant Level I, Level II, Level III, and Level IV wage levels, which represent the 17th, 34th, 50th, and 67th percentiles of earnings for that area and occupation, respectively. For all petitions with salaries between Level I and Level IV (the 17th and 67th percentile for the worker’s occupation and area), the precise earnings percentile can be linearly interpolated from OFLC wage levels using the following formula:
Estimated percentile = PL + (PU – PL)*(x – xL)/(xU-xL),
where xL is the nearest prevailing wage level below the beneficiary’s salary; xU is the nearest prevailing wage level above the beneficiary’s salary; PL and PU are their respective percentiles; and x is the beneficiary’s salary. As an example, consider a hypothetical H-1B petition for an operations research analyst (SOC code 15-2031) in Phoenix, Arizona, with a salary offer of $95,000. The petition’s salary falls between Level III (the 50th percentile, $87,027) and Level IV (the 67th percentile, $101,231) for operations research analysts in the Phoenix-Mesa-Chandler, AZ MSA. The earnings percentile for this petition would be calculated as follows:
50 + (67-50)*($95,000 – $87,027)/($101,231 – $87,027) = 59.4
The petition is then tagged as being at the 59th percentile for this occupation and labor market. For all petitions in the data falling between Level I (the 17th percentile) and Level IV (the 67th percentile), the same methodology is used. Petitions falling below the 17th percentile are set aside and not tagged with a percentile.
The above methodology only allows us to tag H-1B petitions with area-occupation-specific percentiles using linear interpolation if their salaries fall between the Level I and Level IV thresholds. However, many petitions have salaries above the 67th percentile. Given that the DOL rule includes two percentile thresholds above the 67th, it’s important that we also tag petitions that have higher salaries with percentiles.
To estimate percentiles for petitions that exceed their relevant Level IV threshold (67th percentile), we turn to American Community Survey microdata. Using the ACS, we estimate the ratio of the 90th percentile of wage and salary income to the 67th percentile of wage and salary income for every occupation available in the ACS. These ratios are then pulled back into the H-1B petition data, matched according to the most granular occupation code available. Then, the ratio of the 90th to 67th earnings percentiles from the ACS is multiplied by the Level IV prevailing wage level relevant for the specific petition.
For example, if Level IV (the 67th percentile) is $100,000 for a particular occupation in a given metro and the ACS data shows that the 90th percentile worker in that occupation nationally earns 20 percent more than the 67th percentile worker, $100,000 is multiplied by 1.2. This gives us an estimate of the 90th percentile for the area and occupation combination relevant to every H-1B petition. This 90th percentile benchmark is then used to calculate the earnings percentiles of H-1B petitions falling between the 67th percentile (the Level IV prevailing wage provided by the OFLC) and the (estimated) 90th percentile. This is done using the same method of linear interpolation described above.
The output of this step is a file of all H-1B lottery winners in FY 2022, FY 2023, and FY 2024, with each petition tagged with its relevant percentile. These percentiles are used further on in the analysis to simulate different prevailing wage proposals.
Step 2: Fitting Mincer equations to generate area and occupation-specific returns to education and experience.
To both identify H-1B workers who are underpaid relative to similarly qualified American workers and to implement Experience Benchmarking, the Department needs to estimate the earnings of American workers with every possible combination of education and experience within each occupation and labor market. However, OEWS contains no information on education and experience. The Department has historically assumed that its chosen thresholds approximately correspond to the wages of actual “entry-level,” “qualified,” “experienced,” and “fully competent” workers. Adopting its primary proposal in the NPRM would simply change those guesses rather than bringing in real data on experience and education to augment the OEWS data.
Experience Benchmarking combines other government data sources with the OEWS. OEWS currently produces estimates of median (as well as 10th percentile, 25th, 75th, and 90th) pay for hundreds of metropolitan statistical areas (MSAs) and non-metropolitan areas, and hundreds of occupations. BLS provides OFLC a special tabulation from the OES each year that, after further internal OFLC adjustments, serves as the source of the National Prevailing Wage Center’s (NPWC) Prevailing Wage Levels. The Experience Benchmarking method would adjust those medians based on a specific combination of experience and education using a model fit with the ACS.
Here is how Experience Benchmarking works: ACS microdata would be used to fit Mincer equations that model the relationship between education and experience within each specific occupation available with ACS. This can be used to generate a matrix of ratios that compare the typical earnings of workers with each education-experience combination to the overall occupational median (as measured in the ACS, not OEWS).
We estimate the earnings of American workers with every combination of experience and education in each occupation and labor market using a series of Mincer earnings functions fitted with ACS data, combined with OEWS data published by OFLC. We used these functions to adjust OEWS-provided occupation data based on education and experience. As a basis for this analysis, we used OEWS-provided median earnings for each occupation-area combination. These were pulled from OFLC-released prevailing wage data, in which Level III conveniently corresponds to the 50th percentile earnings level. Because OFLC-produced data provides more granularity than BLS’ publicly available OEWS files (and falls back to higher-level geographies when MSA-level estimates are unavailable), OFLC data is used in its stead.
OFLC-provided medians are scaled up or down to derive estimates of market wages for Americans of each combination of education and experience. These scalars (or ratios) are derived from a series of hundreds of Mincer equations estimated on 2019-2023 American Community Survey microdata, pulled from the Integrated Public Use Microdata Series and filtered to those who are employed and are natural-born American citizens.
First, the Mincer equations are used to predict the natural log of wages for each combination of education and experience. The de-logged weighted averages of these predicted wages for each education-experience combination are then divided by the occupation-wide median earnings to create scalars. Those scalars are multiplied by OFLC Level III (median) wages for each area and occupation to generate estimates of typical pay for each combination of experience, education, occupation, and area. These estimates would serve as the set of prevailing wages under Experience Benchmarking.
As an example, if a typical aerospace engineer with 5 years of experience and a PhD earns 20 percent more than the median aerospace engineer, the ratio for the combination of 5 years of experience and a PhD in the occupation of aerospace engineering would be 1.2. This matrix of ratios would then be applied to the OEWS-produced medians for specific geographies and occupations, using the best available occupation match within the ACS. To calculate the prevailing wage for aerospace engineers in Huntsville, AL with 5 years of experience and a PhD, this methodology would take the overall OES median earnings for aerospace engineers in that MSA (currently $139,110) and multiply it by 1.2. The prevailing wage for aerospace engineers in Huntsville with 5 years of experience with a PhD would be $166,932. This would be repeated for every experience-education combination in every geography for each occupation.
The American Community Survey is a large survey, receiving responses from 3 million households annually. Over the 5-year sample used by the Department for this portion of the economic analysis, the sample size is even larger. But for some very specific occupations, the sample size can still be small. For this reason, we can employ a hierarchical structure of Mincer models to generate the ratios necessary to produce a comprehensive set of prevailing wages. When there is insufficient sample size for a particular occupation, we can bump up to a higher-level SOC code and estimate the Mincer equations (still with area fixed effects) for 5-digit, 3-digit, and 2-digit occupation code levels, respectively. In our analysis, we set a minimum threshold in the ACS of 100 observations, which every occupation exceeded.
The Mincer equations take the following functional form, predicting a separate earnings curve for each occupation, so that the logarithm of earnings (wage) for individual i is given by:
log(wagei) = αocc(i) + β₁,occ(i)·expi + β₂,occ(i)·expi² + β₃,occ(i)·expi³ + β₄,occ(i)·expi⁴ + Σγk,occ(i)·educik +δocc(i),g(i)+ εi,
where occ(i) is the occupation of the individual, exp is the individual’s potential experience (Age – Years of Education – 6), educik is a series of dummy variables indicating whether the individual’s highest level of education is one of eight levels of education: less than high school, high school, some college, associate’s degree, bachelor’s degree, master’s degree, professional degree, or doctoral degree, and the parameter δ captures the geography fixed effects, where g(i) is the area of employment of individual i.27
So, with fitted Mincer equations from the ACS, we have what we need to adjust the medians from the OEWS data obtained via OFLC based on a specific combination of experience and education. That gives us our estimate of the median pay of native-born US workers for each combination of education and experience for every occupation and geography covered by the Department’s set of prevailing wage levels.
Estimates of the Mincer equations (specific to each ACS occupation code) and their accompanying ratios are linked to the more granular OFLC SOC codes through a crosswalk.
Step 3: Calculate new prevailing wage levels
The above process produces an estimate of the median pay of American workers for each combination of education and experience for every occupation and geography covered by the Department’s set of prevailing wage levels. Under Experience Benchmarking, these estimates would serve as the minimum pay for visa petitions (i.e., the new set of Level I thresholds).
In implementing Experience Benchmarking, the Department should calculate three additional wage levels for every experience, education, occupation, and area combination to maintain a four-wage structure. These four levels would make Experience Benchmarking fully compatible with the Department of Homeland Security’s new H-1B weighted lottery rule, which assigns H-1B registrations a number of entries corresponding to the highest DOL-provided wage level they meet. If the Department adopted Experience Benchmarking as its methodology for calculating prevailing wage levels, DHS’s H-1B lottery would prioritize registrations for workers earning the largest premiums over similarly qualified American workers. Lottery registrations for workers with salary offers modestly higher than those of similarly qualified Americans (Level I applicants) would get one entry into the weighted lottery, while registrations for workers earning very large premiums (Level IV) would be entered into the weighted lottery four times. We believe this change would more effectively prioritize for visas those candidates who offer truly rare, exceptional, and valuable skillsets.
OFLC should request a tweaked custom tabulation of OEWS data from the BLS. Rather than requesting the 17th, 34th, 50th, and 67th percentiles of wages for every occupation and labor market, OFLC should request the 50th, 62nd, 75th, and 90th percentiles. The methodology described earlier in this analysis used the OEWS-provided 50th percentiles as a starting point, adjusting up or down based on results from a series of Mincer equations to get an estimate of the median pay for American workers with each combination of experience and education in every occupation and area covered by OFLC prevailing wages. This same methodology could also be used to adjust the 62nd, 75th, and 90th percentiles based on the fitted education and experience curves.
ACWIA prevailing wage levels
The same methodology detailed above is used to produce prevailing wage levels relevant for ACWIA. To do this, we use ACWIA prevailing wage levels made available on the OFLC website, again scaled up or down based on ACS-derived returns to education and experience.
-
U.S. Department of Labor, Employment and Training Administration. "Improving Wage Protections for the Temporary and Permanent Employment of Certain Foreign Nationals in the United States." Federal Register 91, no. 59 (March 27, 2026): 15454.
-
Ibid, 15491.
-
See Appendix 1 for more details on the importance, and history, of prevailing wage determinations in US immigration law.
-
David J. Bier, "100% of H‑1B Employers Offer Average Market Wages—78% Offer More," Cato at Liberty, Cato Institute, May 18, 2020.
-
Bier also claims that “DOL estimates the market wage for H‑1B jobs by taking the average wage for workers in the same geographic area and same occupation who have similar levels of experience and skills.” In other words, he asserts that DOL is already using Experience Benchmarking. This is false.
-
See DOL’s General Administration Letter (GAL) 2-98, issued October 31, 1997. Interestingly, the then-new 1997 instructions to State Employment Security Agencies (SESAs) to rely on OES data (it was renamed OEWS in 2021) barred the use of the OES wage data during a 60-day delayed effective date period unless no other sources for a particular occupation and geographic area were available, suggesting that from the outset DOL saw the weakness in relying primarily on OES.
-
Subsections 212(p)(3) and (4) of the INA were added by Section 423 of Pub.L. 108-447, December 8, 2004, in Title IV (Visa Reform) of the Consolidated Appropriations Act of 2005). DOL’s Prevailing Wage Determination Policy Guidance, a 36-page description of the process and how employers should assess prevailing wage levels in compliance with DOL policy, was last updated November 2009.
-
John Miano, "H-1B Statutes Are Carefully Crafted to Be Misleading to the Casual Reader," Center for Immigration Studies (May 26, 2020).
-
George J. Borjas, "The H-1B Wage Gap, Visa Fees, and Employer Demand," NBER Working Paper No. 34793 (March 2026).
-
Daniel Costa and Ron Hira, "EPI comments on DOL Request for Information on determining prevailing wage levels for H-1B visas and permanent labor certifications for green cards," Economic Policy Institute, June 1, 2021. See also Daniel Costa and Ron Hira, "H-1B Visas and Prevailing Wage Levels," Economic Policy Institute (May 4, 2020), which notes that "the wage level is supposed to correspond to the H-1B worker's education and experience, [but] in practice the employer gets to choose the wage level and the government doesn't check."
-
U.S. Department of Labor, Employment and Training Administration. "Improving Wage Protections for the Temporary and Permanent Employment of Certain Foreign Nationals in the United States." Federal Register 91, no. 59 (March 27, 2026): 15489.
-
See Appendix 2 for more methodological details.
-
See Appendix 2 for more methodological details.
-
See Appendix 2 for more methodological details.
-
George J. Borjas, Labor Economics, 7th ed. (New York: McGraw-Hill, 2016), p. 244.
-
In principle, the government could get even better data by linking existing administrative datasets. Specifically, DOL could contract with the Census Bureau for special tabulations drawing earnings, occupation, area, and experience data from linked 1040 data from the IRS and education data from the ACS. However, this would require additional resources and time, not to mention permission from the IRS.
-
Jennifer Hunt, “Which immigrants are most innovative and entrepreneurial? Distinctions by entry visa.” Journal of Labor Economics 29(3), 2011: 417-457 and Natee Amornsiripanitch, Paul A. Gompers, George Hu, and Kaushik Vasudevan, "Getting schooled: Universities and VC-backed immigrant entrepreneurs,” Research Policy 52, no. 7 (2023): 104782.
-
In the 1917 immigration statute, contracted workers were specifically ineligible for entry to the US but the Commissioner of Immigration and Secretary of Labor were also specifically authorized to admit otherwise barred persons. See Section 3 of Pub.L. 64-301 (February 5, 1917, the Immigration Act of 1917).
-
Congress later found there should not be any governmental determination of required wage. See Section 4(b) of Pub.L. 78-45 (April 29, 1943, as part of food production appropriations bill).
-
42 Fed. Reg. 3440 at 3450 (January 18, 1977). DOL established at Section 656.40 of its Immigrant Labor Certification rules that The regulation was primarily promulgated to implement the new “equally qualified” standard for permanent labor certification “special handling” that Congress had enacted for university teaching roles, as opposed to what would thereafter be a minimally qualified standard for regular labor certification. See Sec. 5 of Pub.L. 94-571 (October 20, 1976, the Immigration and Nationality Act Amendments of 1976). Previously, the Labor Department had codified regulations establishing only that employment offered to noncitizens would be deemed to adversely affect wages or working conditions of American workers under the INA’s labor certification provisions unless “it appears” that such employment was “for wage rates no less than those prevailing for US workers similarly employed in the area of employment,” but no method for calculating such prevailing wages was identified other than utilizing the Davis-Bacon Act or other wage board schedules for federal employment. See 36 Fed. Reg. 2462 at 2464 (February 4, 1971).
-
See Sec. 2015 of Pub.L. 101-649 (November 29, 1990, the Immigration Act of 1990 or IMMACT90).
-
See, e.g., DOL’s General Administration Letter (GAL) 4-95, issued May 18, 1995.
-
See DOL’s General Administration Letter (GAL) 2-98, issued October 31, 1997. OES (Occupational Employment Statistics) was renamed OEWS in 2021 (Occupational Employment and Wage Statistics).
-
Section 212(p) of the INA, first codifying the computation of prevailing wage levels for H-1B, H-2B, and permanent labor certification, was added by Section 415 of Pub.L. 105-277 (October 21, 1998, the American Competitiveness and Workforce Improvement Act).
-
See, e.g., DOL’s Training and Employment Guidance Letter (TEGL) 5-02, issued August 7, 2002.
-
Subsections 212(p)(3) and (4) of the INA were added by Section 423 of Pub.L. 108-447, December 8, 2004, in Title IV (Visa Reform) of the Consolidated Appropriations Act of 2005). DOL’s Prevailing Wage Determination Policy Guidance, a 36-page description of the process and how employers should assess prevailing wage levels in compliance with DOL policy, was last updated November 2009.
-
For those with less than a high school degree, years of education is equated with the number of grades completed. For those with a high school degree or GED, we assume 12 years of education. For those with some college but less than an associate’s degree, we assume 13 years of education. The remaining categories are as follows: Associate’s degree holders are assigned 14 years of education; bachelor’s degree holders are assigned 16 years of education; master’s degree holders are assumed to have 18 years of education; professional degree holders are assumed to have 19 years of education; PhD holders are assumed to have 23 years of education.