-
- Executive summary
- How big is the US-China AI capabilities gap?
- What explains the gap?
- How much AI compute does China have, and where does it come from?
- Would reducing China’s AI compute access also reduce chip sales for US companies?
- How much could policy interventions extend the US AI lead?
-
Appendices
- Appendix 1: Estimating the US-China AI capabilities gap
- Appendix 2: Translating relative US-China compute access and distillation into months of US lead
- Appendix 3: Estimating ASML’s 2026 DUV immersion sales to China
- Appendix 4: Estimating China’s stock of domestically produced AI chips
- Appendix 5: Estimating China’s legal imports of AI chips
- Appendix 6: Estimating reductions in AI chip smuggling to China
- Appendix 7: Estimating China’s overseas AI compute access in 2026 and 2027
Executive summary
The US’s top AI models lead top Chinese models by only about 6.5 months. This is despite US AI companies having significantly better compute access and financing. Over the next year, the size of this gap is important for:
- Which country can better capture the economic gains of frontier AI.
- Giving the US a greater cyberdefensive advantage against Chinese threat actors.
- Providing the US leverage in negotiations with China about the future of AI.
- Giving US AI companies breathing room to spend R&D resources making their systems safer and more secure.
- Widening the associated option space for US policymakers.
In this report, we quantify the factors that contribute to the size of the US-China AI capabilities gap, and use this to score policy interventions that could increase the US lead over the next year. We assess that a set of successfully implemented near-term policies — using existing executive branch authorities — could roughly double the US lead by the end of 2027. Our specific findings are as follows:
The size of the US-China AI capabilities gap is largely downstream of two factors US policymakers can influence today: China’s access to AI chips, and China’s ability to distill the capabilities of US models.
- Companies from the US and allied countries dominate the supply chain for advanced AI chips, and the Bureau of Industry and Security (BIS) has authorities to maintain the US compute advantage by export-controlling both chips themselves and the tools used to build them.
- Chinese companies’ ability to adversarially distill the capabilities of top US models lets them acquire capabilities such as reasoning, coding, and tool use at a small fraction of the cost it took the US company to train the original model. US companies and the US government have publicly documented multiple instances of top Chinese AI companies doing this at scale.
We estimate China’s access to AI chips will roughly double between the end of 2026 and the end of 2027. Of the portion of these chips that the US could restrict China’s access to, around half are in data centers outside China that the Chinese AI ecosystem will access remotely.
- We estimate China will have access to around 4.6 million H100-equivalents (H100-eq)1 of AI compute by the end of 2026, and 8.8 million H100-eq by the end of 2027. These chips come from China’s domestic production, legally imported US AI chips, smuggled US AI chips, and US AI chips remotely accessed in data centers outside China. US AI chips will make up around 65% of China’s total stock by the end of 2027.
- About 35% of China’s expected AI chip stock for year-end 2027 is already in China. Of the remaining 65%, about half comes from remote access, which can be almost entirely restricted today with new export controls from BIS.
Restricting Chinese access to US AI chips is unlikely to reduce total US sales, as demand outside China is expected to outpace supply through at least the end of 2027.
- All major suppliers of the advanced memory needed for US AI chips report that their capacity is booked out through 2027, with chip designers only receiving 60 to 70% of their requests. Two months ago, NVIDIA told investors it expects supply constraints through at least fiscal year 2028.
- In this supply-constrained market, if an AI chip cannot be sold to a Chinese customer, another buyer is highly likely to purchase it. The same holds for cloud capacity; US clouds could otherwise rent GPUs to compute-constrained US companies instead of a Chinese company overseas. Restrictions would thus likely redirect sales, largely to US customers, rather than reduce them.
Adversarial distillation makes compute controls less effective by allowing Chinese AI companies to extract the capabilities of US frontier AI models without needing significant AI compute of their own.
- Distillation becomes a more effective catch-up strategy for China as the US AI compute advantage grows, because Chinese AI companies can distill the capabilities of even more powerful models.
- Distillation allows Chinese companies to recapture about half of the US lead in capabilities, by our estimates. Without distillation, we estimate that today’s 16x US training compute advantage would yield a 13-month lead over China. With distillation, this gap reduces by roughly 6.5 months — equivalent to top Chinese AI companies having 4x more AI chips than they do today. This means addressing distillation makes any interventions to increase the US compute advantage much more effective.
- However, China cannot use only adversarial distillation to gain a lead over the US, as the practice only ever allows extracting the existing capabilities of US frontier models. This makes compute controls the more important overall intervention.
We estimate that a set of viable policies using existing executive branch authorities could roughly double the current US AI lead by the end of 2027, if implemented today:
- A narrow antitrust safe harbor to enable US companies to collaborate on combating adversarial distillation.
- New export controls restricting Chinese AI companies’ ability to remotely access training clusters abroad.
- Strengthened due diligence requirements to reduce AI chip smuggling.
- Updated export controls to cover AI chips that are currently permitted for legal export to China.
- New export controls, red-flag guidance, and targeted investigations to reduce smuggling of foreign high-bandwidth memory (HBM) into China.
The interactive tool below shows our estimates of how implementing these policies would boost the US lead over China. We estimate these policies would gain 6.6 months of additional lead for the US. For reference, in an extreme hypothetical, where China’s AI compute is frozen at today’s level and adversarial distillation completely stops, the US would gain an additional 11.4 months.
How much could US policy extend America’s AI lead over China by the end of 2027?
Choose a policy package to see how it changes our projection for the US lead in frontier AI by the end of 2027.
High-level estimates based on a simplified model. See Appendix 2 for methodology.
See the numbers
| Today | 2027, no new action | 2027, selected |
|---|
Adjust the assumptions
Each slider sets how much of a channel for Chinese AI capabilities growth is limited. The checkboxes set our estimates for specific policies. Changing values switches to a custom scenario.

These gains will compound, and even a few months of added lead could be highly meaningful by the end of 2027.
- At today’s rate of AI progress, the extra lead could create a crucial defensive advantage in capabilities such as cybersecurity.
- It would also allow the US government more time to evaluate and respond to national security risks from AI. As US companies attempt to automate their AI R&D, these months could prove critical for policymakers.
- With these interventions, gains from increasing the US lead over the next year will compound over time. Additional policy interventions could widen the gap even further, including stronger export controls on SME (especially deep-ultraviolet immersion lithography systems) to limit China’s longer-term access to AI chips, and requiring stronger model-weight and algorithmic security at US frontier labs, so China cannot quickly close the gap by stealing critical US IP.
How big is the US-China AI capabilities gap?
We estimate that the general capabilities of top Chinese2 AI models lag the US frontier by 6.5 months.3 We use the Epoch Capabilities Index (ECI), which combines many different AI benchmarks into a single scale.4 We do this for three reasons:
- Because it aggregates performance across a variety of tasks (e.g., coding, science, writing), ECI is the best measure of general capabilities for AI models.
- It is resistant to common problems with individual benchmarks: saturation5 and “contamination,” a practice that leads to many individual benchmark scores for Chinese models overstating their underlying capabilities.6
- ECI scores are available for a wide range of Chinese and US models.
This finding appears reasonably robust against different ways of measuring model capabilities. When measured instead on models’ software engineering skills (specifically “time horizons”7), the gap is similar — around 6.6 months.8
Early this year, Claude Mythos became the first frontier AI model to raise serious national security concerns. Both the general capabilities gap and the time horizons gap predict that a Chinese AI company will first release a model with Mythos-level capabilities by the end of 2026.9
Whether this gap grows or shrinks matters for US policymakers. A larger gap:
- Increases frontier AI’s returns to the US economy by giving American companies time to diffuse frontier AI capabilities before their Chinese competitors.
- Gives the US a greater cyberdefensive advantage against Chinese threat actors.
- Lends the US more leverage in negotiations with China about the future of AI.
- Allows US AI companies breathing room to spend more resources on making their systems safer and more secure.
- Widens the associated option space for US policymakers.
What explains the gap?
AI capabilities come from the following factors:
- Algorithms: new insights for improving the code that trains and runs AI models.
- Datasets and reinforcement learning (RL) environments: data and software used to impart domain knowledge and skills to models during training.
- Compute: AI chips in data centers used to train models (by running the algorithms that learn from data and RL environments) and scale up their effort on a task during inference (by running models for longer or running more copies of a model).10 Inference compute is also increasingly used to automate the process of discovering new algorithmic insights, speeding up AI R&D.11
Of these three, compute is the input US policymakers can most immediately shape with the tools available to them.12 Companies from the US and allied countries dominate the supply chain for advanced AI chips, and the US government via BIS has authorities to maintain the US compute advantage by export controlling both chips themselves and the tools used to build them.13
Another key factor influencing the size of the US-China AI capabilities gap is model distillation.14 Chinese companies’ ability to adversarially distill the capabilities of top US models lets them acquire capabilities such as reasoning, coding, and tool use at a small fraction of the cost it took the US company to train the original model. US companies and the US government have publicly documented multiple instances of top Chinese AI companies doing this at scale.15
Crucially, the larger the US compute advantage, the more effective adversarial distillation becomes as a catch-up strategy for Chinese AI companies. This is because they can distill the capabilities of relatively more powerful models while needing comparatively less compute. To widen the lead over China, US policymakers should consider compute and counter-distillation interventions in tandem, not as separate levers.
Modeling the US AI lead
We use a simple model to estimate how relative compute access and distillation affect the US-China capabilities gap. To derive the model, we observe that exponential increases in compute advantage lead to constant increases in capability lead (measured in months). China then recaptures some share of that lead through distillation. For instance, if distillation captures back 50% of the capability lead, then the US could have a 1-year lead based on compute, but only a 6-month lead after accounting for distillation.
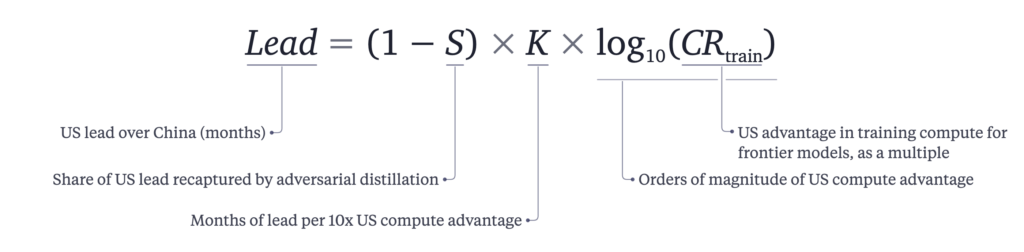
We calibrate the model to today’s 6.5-month lead and to estimates of how much distillation narrows it (see below). From there, we can estimate the effect of different policy interventions on the US lead.
This model is high-level and makes many simplifying assumptions. It should thus be understood as a way to measure the broad impact of different policy interventions, rather than as a highly accurate prediction of how many months of lead each intervention gains. For the full model, see Appendix 2.
How much do Chinese companies gain from adversarial distillation?
Our estimates suggest adversarial distillation by Chinese companies recovers about half of the capabilities gap with US companies, implying the following:
- Without distillation, today’s roughly 16x US training compute advantage for frontier models would yield a ~13-month lead over China.
- With distillation, the US lead reduces to ~6.5 months (around a 6.5-month gain for China). This capability boost is equivalent to giving China 4x more physical compute.
This dynamic grows with scale. If the US held a 100x compute advantage, distillation would provide the equivalent AI capabilities gain to China as if it had 10x more physical compute.
We assess how much distillation techniques allow China to catch up to the US via two separate estimates. The first indexes on an estimate from Anthropic, which suggests Chinese models recover about 50% of the capabilities gap between them and top US models using distillation. The second uses experiments published by DeepSeek about how much a model can improve its benchmark scores via distillation. This approach implies that student models can recover about 51% of the capabilities gap.16 If these results generalize to other distillation cases, it implies that distillation techniques can recover around half of the capabilities gap.
Assessing any policy’s effects still requires knowing how much compute China currently has access to, and where that compute comes from. We turn to this question next.
How much AI compute does China have, and where does it come from?
Chinese AI developers access all of their AI compute via four channels:
- Purchasing domestically manufactured chips.
- Legally importing US-designed chips.
- Illegally smuggling restricted US-designed chips.
- Remotely accessing chips via data centers located outside China.
Across these channels, we estimate China will have access to around 4.6 million H100-eq by the end of 2026, and 8.8 million H100-eq by the end of 2027.
In the rest of this section, we describe our methodology and results for each channel in further detail.
Domestic production
China can make a limited number of AI chips domestically. We estimate China will produce around 986,000 H100-eq in 2026,17 and 1.3 million H100-eq in 2027,18 on top of its existing end-of-2025 stock of 743,000 H100-eq.19
To make these chips, China relies heavily on semiconductor manufacturing equipment (SME) imported from the US and its allies. This SME is required for manufacturing both of the core components of an AI chip:
- Logic, which performs the chip’s calculations.
- Memory, which handles high-speed data transfers.
China’s chipmakers have ample supply of the tools needed to make logic. Since the late 2000s, China has built up a fleet of “deep ultraviolet immersion” (DUV-i) lithography systems from ASML, a Dutch SME company.20 These systems can manufacture 7nm logic, and Huawei, China’s largest AI chip designer, uses that logic in its Ascend AI chips. US and allied export controls still only partially restrict these systems. The Center for Technology and Statecraft (CTS) estimates that China had around 270 DUV-i systems in as of Q1 2026. We estimate around 54 more will be sold to China by the end of this year.21
These DUV-i systems create an upper limit on China’s AI chip production capacity. Assuming DUV-i access is the only constraint on production, CTS estimates China can produce 1 million H100-eq in 2026 at the current trend. In an “AI push” scenario, where China prioritizes AI chips in its DUV-i fleet up to the same allocation forecasted in the US ecosystem, China could reach 4 million H100-eq. For 2027, it estimates 2 million H100-eq on the current trend, and 11 million H100-eq in an AI push scenario.
Whether China can reach those numbers depends on its memory supply, specifically high-bandwidth memory (HBM). HBM is crucial for high-performance AI chips, enabling the extremely fast data transfers modern AI workloads require.
China, however, has limited access to HBM: it cannot produce HBM domestically at scale, and export controls block imports of foreign HBM. Using data from Epoch and other sources, we estimate that only around 16% of Huawei’s AI chip production will use domestic HBM this year. Huawei likely makes up the remaining 84% of AI chip output by turning to non-HBM memory, smuggled HBM, and pre-control HBM stockpiles.22
Combining those Huawei estimates with data on other Chinese AI chip design companies lets us estimate Chinese AI chip production for 2026 and 2027, accounting for memory constraints. Our estimates suggest that China will produce around 986,000 H100-eq in 2026 (range: 662,000 to 1.4 million) and 1.3 million H100-eq in 2027 (range: 839,000 to 2.1 million), on top of its existing end-of-2025 domestically produced AI chip stock of 743,000 H100-eq (range: 598,000 to 945,000). This leads to a total stock of 1.7 million H100-eq by the end of 2026 (range: 1.4 million to 2.2 million), and 3 million H100-eq by the end of 2027 (range: 2.3 million to 4.2 million).23
By these estimates, HBM constraints mean China will produce around 4–8x less than it could otherwise, only reaching around 1–2% of total US AI chip production in each year.
Legal imports
Over the past several years, China has imported a range of legally available US AI chips. The specific chips available have shifted year to year, which we summarize below. We estimate China will hold a cumulative stock of roughly 846,000 H100-eq from legal imports in 2026,24 and 1.35 million H100-eq in 2027.25
Dedicated AI chips
In January 2026, BIS issued new regulations permitting the case-by-case export of NVIDIA’s then-previous-generation flagship chip, the H200, and AMD’s MI325X to China.26
Both US and Chinese restrictions have limited chip sales so far, despite more than 2 million GPUs’ worth of reported orders for the H200 after President Trump announced the decision late last year. BIS capped Chinese exports at 75,000 H200s per customer. Chinese regulators initially banned H200 imports into mainland China, but later permitted small quantities, with larger quantities allowed into Hong Kong. In July, NVIDIA disclosed that it had sold only a fraction of the H200s permitted under the licensing program, and that it had written down $400 million in excess H200 inventory.
Based on public reporting, around 20,000 H200s have been shipped to China as of the time of writing, with Chinese hyperscalers ByteDance and Tencent receiving 10,000 each. By the end of 2026, we estimate the total quantity could reach around 100,000 (range: 20,000 to 200,000).27 This stock would add to the roughly 400,000 H100-eq of NVIDIA and AMD AI compute that has been legally sold to China between 2022 and year-end 2025 (range: 309,000 to 523,000).
Gaming and workstation chips
Chinese firms have also reportedly bought more than 1 million NVIDIA gaming and workstation cards in 2026 to use on AI workloads. These cards comply with US export controls, mostly the RTX Pro 6000D, RTX Pro 5000, and RTX 5090D. These cards are weaker than dedicated AI chips and suited mainly to inference, but at this scale add an estimated 344,000 H100-eq (range: 220,000 to 424,000), more than the H200s.
Adding these figures to our dedicated AI chip estimates, and applying our own adjustments, we estimate China will hold a cumulative stock of roughly 846,000 H100-eq from legal US AI chip imports in 2026 (range: 674,000 to 1.02 million).28 This figure could rise to about 1.35 million H100-eq in 2027 (range: 986,000 to 2.04 million), driven by further H200 shipments and NVIDIA’s forthcoming RTX Pro 5500 workstation card, for which Chinese firms have reportedly indicated orders exceeding 2 million units. We do not model the effects of potential future license exceptions for more powerful GPUs, such as NVIDIA’s Blackwell and Vera Rubin generations. If these GPUs were permitted for export in significant quantities, they would dramatically boost China’s access to AI compute.29
Smuggling
Recent Department of Justice indictments and media reports on large-scale chip smuggling operations point to significant black-market networks aimed at circumventing US export controls. Several of these alleged smuggling attempts involved NVIDIA AI servers worth up to billions of dollars, as in the Super Micro case. Overall, we estimate China will hold a cumulative stock of smuggled US AI chips of 1 million H100-eq by the end of 2026,30 and 1.6 million H100-eq by the end of 2027.31
To estimate smuggling, we start with Epoch AI’s 2024 and 2025 estimates, which combine documented diversion cases with surveys of gray-market resellers. It then scales up its estimates to account for smuggling cases that were likely never detected. Epoch estimates that about 159,000 H100-eq were smuggled into China in 2024 (range: 64,000 to 419,000) and about 480,000 in 2025 (range: 189,000 to 1.29 million). Epoch’s cumulative estimate is around 663,000 H100-eq (range: 294,000 to 1.59 million) by the end of 2025.
These smuggling estimates are a remarkably consistent fraction of total US AI chip production in each year: 2.94% in 2024, and 3.00% in 2025.32 This provides a plausible upper bound: the number of available AI chips to smuggle depends on total production, which grows with global demand for AI chips (including demand for smuggled chips). Applying the same fraction to US production in 2026 and 2027 implies 1.3 million H100-eq smuggled in 2026, and 3.7 million in 2027.
There is some evidence, however, that smuggling has shrunk in 2026 relative to 2025:
- Customs data compiled by Epoch AI suggests that smuggling of AI servers to China via Malaysia spiked from early 2024 and collapsed after Malaysia began requiring permits to export or transship advanced AI chips in July 2025. We replicated this analysis and extended it to find origin countries for AI servers that show signs consistent with smuggling.33 In the two origin countries for those possibly smuggled servers (Malaysia and Singapore, both known AI chip smuggling hotspots), we observe an 82% decline in Chinese server imports.
- The Financial Times reported that prices of NVIDIA B300 servers in China doubled in the six months leading up to June 2026, consistent with tighter supply.
- The Financial Times also reported that in the first half of 2026, NVIDIA intensified its due diligence process in Singapore, Malaysia, and Japan, leading to half of its previous buyers failing the new screening.
Given these factors, we assume that AI chip smuggling to China is somewhere between the low end implied by the Singapore and Malaysia data (an 82% decline from 2025, holding flat through 2027) and the high end implied by US AI chip production (2.97% of US production in 2026 and 2027). Our final estimates are as follows:
- 2024 and 2025: 663,000 H100-eq (range: 294,000 to 1.6 million), from Epoch’s estimate.
- 2026: 341,000 H100-eq (range: 87,000 to 1.3 million), as per the methodology above, and taking the geometric mean for our central estimate.34
- 2027: 568,000 H100-eq (range: 87,000 to 3.7 million), using the same methodology.
China’s total implied stock of smuggled AI chips then becomes:
- End of 2026: 1 million H100-eq (range: 381,000 to 2.9 million)
- End of 2027: 1.6 million H100-eq (range: 468,000 to 6.7 million)
Remote access
US AI chips hosted in overseas data centers are a significant source of compute for China, but difficult to size. Chinese entities can rent GPUs as a service from cloud providers or lease data center capacity overseas, directly from developers or through intermediaries. Cloud providers and data center developers rarely name their customers or disclose how much capacity each uses, and Chinese companies disclose little themselves. Often, Chinese hyperscalers’ rental arrangements are held off-book, making them difficult to detect in financial reports.35 As a result, the potential upper bound is enormous. The Institute for AI Policy and Strategy (IAPS) estimates China’s remote access could range from 670,000 to 9 million H100-eq. Given that the top end of this range represents all AI compute commercially available to rent, the actual number is likely closer to the bottom end.
We estimate that China will have access to roughly 1 million H100-eq of AI compute via remote access by the end of 2026, rising to around 2.8 million by the end of 2027 (range: ~680,000 to 1.46 million in 2026, and 1.97 to 3.91 million in 2027).36
This estimate consists of two parts.
First, we aggregate publicly identifiable Chinese GPU clusters: ~280,000 H100-eq in 2026 and ~861,000 in 2027 come from Chinese AI clusters we observe directly.37 These are clusters that media reporting or company filings attribute to a Chinese customer, rented from neoclouds or Western cloud providers.38 Examples include ByteDance’s Blackwell cluster in Norway and Tencent’s 100,000-GPU lease with Oracle. We compare these clusters to some of the largest AI facilities operational in the United States today:
Second, we estimate an AI share from Chinese overseas data center leasing: we infer ~775,000 H100-eq in 2026 and ~1.97 million H100-eq in 2027 from SemiAnalysis’s data on Chinese hyperscalers’ leasing overseas.39 This covers all leased data center capacity, including for non-AI hardware, and excludes the neocloud and Western cloud rentals counted in the previous part.40 Our central estimate assumes that all leased capacity is operational, and that each region’s leases match the AI share of all data center capacity added in that region in the year leases were signed.41 Finally, we assume that Chinese hyperscalers will use this capacity to access export-controlled GPUs. For 2026, we assume the chips in this capacity match the cumulative mix of Hoppers and Blackwells shipped through the third quarter of 2026.42 For 2027, we assume that new leases will use a mix of Blackwells and next-generation Rubins.43
Combining these two sources yields around 1 million H100-eq accessible to China via remote access by the end of 2026,44 and around 2.8 million H100-eq by the end of 2027.45 These data centers are heavily concentrated in Southeast Asia — around 75% of the total.
Would reducing China’s AI compute access also reduce chip sales for US companies?
Restricting Chinese access to AI compute would reduce US chipmakers’ unit sales only if other customers couldn’t absorb the resulting excess supply. With demand outside China expected to exceed supply through at least 2027, they very likely can.
US cloud providers have said repeatedly this year that they lack sufficient compute to meet customer demand. In July, AWS said it will “still not have enough capacity to meet all the demand we have in 2026” and that it expects the same in 2027. Microsoft has described an “extreme moment” in customer demand for compute relative to supply, and Google said its cloud revenue growth would have been higher with more compute.46
Unmet demand stems from extreme supply bottlenecks in AI chip manufacturing. Nearly every advanced AI chip depends on the same three key inputs: TSMC’s advanced logic wafers, HBM, and advanced packaging. Because every chip needs all three, production is bottlenecked by whichever input is scarcest. As we documented in March, these bottlenecks were already severe earlier in the year. Shortages have deepened since then, especially on HBM: all major HBM suppliers report their capacity is booked out through 2027, with chip designers receiving only 60–70% of their requests. SK hynix has forecast 2027 to be the “worst year in the industry’s history from a supply perspective” and for demand to continue to outstrip production past 2030.47 As a result, NVIDIA told investors in August that it expects supply constraints through at least the 2028 fiscal year.
In this supply-constrained market, if an AI chip cannot be sold to a Chinese customer, another buyer is highly likely to purchase it. The same holds for cloud capacity; US clouds could otherwise rent GPUs to compute-constrained US companies instead of a Chinese company overseas. Restrictions would thus likely redirect sales, largely to US customers, rather than reduce them.48
How much could policy interventions extend the US AI lead?
Armed with an understanding of China’s different pathways to compute access, we can assess how different policies will increase the US AI lead.
The tool below estimates how many months of additional lead the US will gain over China by implementing interventions that do one or both of:
- Reducing China’s ability to adversarially distill US models.
- Reducing China’s AI compute access relative to the US.
A distillation intervention reduces the fraction of capabilities that Chinese AI companies can distill from US models.49 A compute intervention reduces the amount of compute Chinese AI companies can allocate to training new models.
As previously discussed, compute interventions become more effective at increasing the US lead if distillation is also addressed.
The default settings show a set of viable policies that we roughly estimate would double the current US AI lead by the end of 2027, if implemented today:
- A narrow antitrust safe harbor to enable US companies to collaborate on combating adversarial distillation.
- New export controls restricting Chinese AI companies’ ability to remotely access training clusters abroad.
- Strengthened due diligence requirements to reduce AI chip smuggling.
- Updated export controls to cover chips currently permitted for legal export to China.
- New export controls, red-flag guidance, and targeted investigations to reduce foreign HBM smuggling into China.
These interventions rely only on existing executive branch authorities. We describe each of them in more detail below.
How much could US policy extend America’s AI lead over China by the end of 2027?
Choose a policy package to see how it changes our projection for the US lead in frontier AI by the end of 2027.
High-level estimates based on a simplified model. See Appendix 2 for methodology.
See the numbers
| Today | 2027, no new action | 2027, selected |
|---|
Adjust the assumptions
Each slider sets how much of a channel for Chinese AI capabilities growth is limited. The checkboxes set our estimates for specific policies. Changing values switches to a custom scenario.
Countering adversarial distillation
Recent Chinese distillation attempts are industrial-scale campaigns, where fraudulent accounts operated by Chinese entities interact with US models via commercial APIs.50 Today’s industry-led defenses against adversarial distillation involve:
- Detecting distillation attempts and then banning the associated accounts.
- Making it more difficult for distillers to access the most useful information for capability extraction, such as the model’s chain of thought.
However, comprehensively defending against adversarial distillation across all US frontier AI companies is difficult:
- Each company must defend against sophisticated networks of hundreds of thousands of fraudulent accounts using seemingly real credentials.51
- Distillers’ tactics constantly change, requiring each company to continually update its defenses.
- If any US frontier AI company does not implement as strong defensive measures as its peers, the US’s overall defense against adversarial distillation becomes much weaker, as distillers can translate their operations to whichever model API has the weakest defenses.52
Two near-term policy measures described below can help address these issues. We roughly estimate that success at the first could reduce the amount of data harvested by distillers by 95%.53 Because each tenfold increase in distilled data volume adds about the same capability gain, meaningfully addressing distillation requires harvested data reductions at around this level.54
An antitrust safe harbor for counter-distillation coordination
Better industry coordination can meaningfully address these difficulties. Companies could share best practices for defense as well as intelligence about specific organizations and individuals involved in adversarial distillation. Today, uncertainty about antitrust law makes US AI companies cautious about this kind of coordination. We expect that addressing this is the single best defense that the US government could implement today against Chinese adversarial distillation.
As a next step, the Department of Justice and Federal Trade Commission could issue a joint letter confirming that sharing threat information and defensive techniques to counter adversarial distillation does not violate antitrust law. The letter should cover the full scope of US actors who need to coordinate, i.e., AI companies, cloud providers, and API aggregators like OpenRouter.
Sanctions for deterring adversarial distillation
Sanctions on a handful of key actors could show the broader Chinese ecosystem that adversarial distillation carries significant financial risk. This could reduce the scale of attacks on US companies, making defense easier.
Executive Order 13694, as amended, authorizes the Treasury Department to sanction foreign persons responsible for cyber-enabled activities that significantly misappropriate trade secrets, personal identifiers, or financial information for competitive advantage or private financial gain. It also covers anyone who provides material or technological support to those activities. The Office of Foreign Assets Control has already used this authority against cybercrime infrastructure, sanctioning hosting providers such as Aeza Group and Media Land for serving ransomware gangs. The same authority could target foreign persons harvesting credentials or operating transfer stations that enable distillation campaigns.
Sanctions could also be extended to Chinese AI companies. The Protecting American Intellectual Property Act of 2022 already requires the President to identify and sanction foreign companies that benefit from significant theft of US trade secrets. This could arguably provide a statutory basis for action.
Reducing China’s compute access
BIS has a range of authorities to limit all of China’s existing remote access to compute and China’s access to future compute acquired through domestic production, legal imports, or smuggling. The most effective channel to limit is remote access, given its outsized impact on the US-China AI capabilities gap by the end of 2027.
Export controls on remote access
BIS has three viable pathways for effectively controlling remote access using its existing authorities:55
- A license condition on chip exports.
- A new export control on frontier model weights.
- A new remote access end-use control.
The table below summarizes each option and the main factors dictating its effectiveness.
If BIS implemented a new control restricting Chinese access to all overseas clusters large enough to support frontier AI model training in a list of countries, China would effectively lose all of the remotely accessed compute that affects the US lead in our model for each of these countries. However, it would retain access to compute for other purposes, such as inference for AI applications. Based on the end-use control option above, we model this effect as applying globally, except for the US.
Strengthened due diligence to reduce AI chip smuggling
Most smuggled AI chips reach China through a network of intermediaries — distributors, server builders, and neoclouds in Southeast Asia — that pass them on to Chinese end users.56 Better screening of these buyers has proven effective. In July 2026, the Financial Times reported that NVIDIA, under pressure from Washington, had intensified its due diligence in Singapore, Malaysia, and Japan, with staff visiting customers’ data centers, verifying contracts, and interviewing end users. The renewed vetting excluded more than half of NVIDIA’s previous customers in these markets, many of them neoclouds, and industry insiders have credited the crackdown with contributing to a shortage of AI chips in China.
However, regulation does not require this screening, and it applies only to NVIDIA’s own direct customers. Making similar checks mandatory, and extending them to server makers and distributors, would close many of the channels smugglers rely on today.
BIS can do all of this under existing authority. The Export Control Reform Act authorizes the Commerce Department to “require measures for compliance with the export controls” (50 U.S.C. § 4813(a)(7)), to impose conditions on licenses (§ 4813(a)(5)(A)), and to “require and obtain such information … as is necessary” from exporters (§ 4813(a)(8)). BIS has already used these powers to mandate due diligence in the chip supply chain. Its January 2025 foundry due diligence rule required chip foundries and packaging firms to screen their customers and report on shipments. Its January 2026 rule on H200-class exports also makes exporters submit their customers’ know-your-customer procedures as a condition of the license. A strengthened due diligence rule would extend these existing requirements to all exports, re-exports, and in-country transfers of controlled AI chips.
We speculatively model this intervention as reducing future expected smuggling by 50% through the end of 2027, based on NVIDIA’s strengthened due diligence excluding “more than half” of previous customers in affected markets.
Restricting currently legal AI chip imports
BIS could restrict each of the two classes of chips that we currently expect China to legally import through the end of 2027 for use in AI data centers:
- NVIDIA H200s: BIS’s January 2026 rule moved exports of H200- and MI325X-class chips to China from a presumption of denial to case-by-case review. Approval is subject to conditions, including exporters certifying that sales will not delay US customers’ orders or divert foundry capacity from US chips. BIS could block these licenses by asserting that these certifications are invalid under current supply chain constraints, or by using § 750.8 of the EAR to revise, suspend, or revoke already issued licenses.
- RTX gaming and workstation cards: These cards are likely designed to fall below the performance thresholds of current advanced chip export controls, so they don’t need a license for China. However, reporting suggests Chinese AI companies are still using these chips to run AI workloads. BIS’s fastest option is an “is informed” letter, which notifies an exporter that a license is required because of an unacceptable risk that items will be used in or diverted to a restricted end use. These include supercomputers in China (EAR § 744.23(b)). BIS likely used this mechanism in April 2025 to impose a license requirement on NVIDIA’s H20 chip. A more durable fix would amend the Commerce Control List so the controls capture these cards directly, though any such change should seek to minimize negative effects on sales to gaming customers and other relevant industries. Any policy intervention should first assess whether these cards can effectively be used for frontier AI R&D (including RL). If not, updated controls are likely not necessary.
We model the impact of these interventions as removing all expected exports of both types of chips to Chinese customers through the end of 2027.
Reducing foreign HBM smuggling
China cannot yet produce HBM at scale, and US controls since December 2024 have barred the export of HBM to China, including foreign-made HBM from Samsung and SK Hynix, under the Foreign Direct Product Rule. However, in late 2024 and early 2025, Taiwanese firms reportedly loosely co-packaged Samsung HBM to simple logic chips that appeared export-compliant, but allowed the memory to be removed once in China. That channel has since reportedly been shut, but excess revenue at a Taiwanese distributor suggests smuggling continued into 2026.
Several measures could close the remaining channels:
- BIS could close the co-packaging loophole by controlling any chip co-packaged with HBM that would otherwise be controlled or by adding total memory bandwidth as a control parameter. It can accomplish this by amending the Commerce Control List under its authority to maintain the list of controlled items (50 U.S.C. § 4813(a)(1)).
- BIS could issue red-flag guidance warning chipmakers, packaging firms, and distributors about orders for HBM packaged so it can be easily removed after export.
- BIS could investigate whether Taiwanese or South Korean suppliers knowingly violated the controls, and impose penalties large enough to deter others.
We model these interventions as preventing 9% of Chinese domestic chip production through the end of 2027, based on the share that we estimate relies on foreign HBM.
Appendices
Appendix 1: Estimating the US-China AI capabilities gap
This appendix estimates the average lag, in months, between when a US-developed model first reaches a given capability level and when a China-developed model first matches it. As above, we measure capability using Epoch AI’s Epoch Capabilities Index (ECI)57 and METR’s software task time horizon benchmark.58 We obtain a lag of 6.5 and 6.6 months, respectively.
Our approach for each of the two benchmarks is as follows:
- We partition each scored model into two categories by the country of the developing organization.
- “US” covers any model from a US-headquartered developer, whether open- or closed-weight (OpenAI, Anthropic, Google DeepMind, Meta, Microsoft, and others).
- “China” covers any model from a China-headquartered developer, whether open- or closed-weight (DeepSeek, Alibaba/Qwen, Moonshot/Kimi, Zhipu/GLM, and others).
- Within each category, we compute a Pareto frontier (i.e., a running maximum benchmark score by release date) and fit a linear trendline through the points on that frontier. If multiple releases break records on the same day, the releases are collapsed to the day’s maximum.
- We measure the horizontal lag between the two trendlines at the top of the China frontier — that is, how many months earlier the US trend reached the capability level of the most recent Chinese frontier model.
Epoch Capabilities Index
Applying these assumptions to the ECI dataset (2024 onward) yields 20 US frontier-defining points (GPT-4 Turbo in January 2024 through GPT-6 Astra in September 2026) and 17 China frontier-defining points (DeepSeek-V2 in May 2024 through Kimi K3 in July 2026).
Fitting linear trends through these points, the US frontier grows at 1.31 ECI/month (R²=0.99) and the China frontier at 1.18 ECI/month (R²=0.97). On this definition, the US frontier is pulling ahead slightly, so the gap is modestly widening over time.
The gap between the China and US trendlines as of the most recent data points implies a lag of roughly 6.5 months.
METR software task time horizon benchmark
Applying the same approach to METR’s software task time horizon benchmark (2024 onward, 50% time horizon values) yields 14 US frontier-defining points (Claude 3 Opus in March 2024 through Claude Mythos Preview in April 2026) and 6 China frontier-defining points (Qwen2-72B in June 2024 through Kimi K2 Thinking in November 2025).
Time horizon scores grow exponentially. Fitting log-linear trends, the US frontier doubles every 3.3 months (R²=0.98) and the China frontier every 3.7 months (R²=0.86) — broadly similar growth rates, with the US frontier doubling slightly faster. The gap between the China and US trendlines at the most recent data points implies a lag of roughly 6.6 months.
METR’s latest release (v1.1) re-scored only US models and dropped every Chinese model, so the Chinese time horizons are taken from the earlier v1.0 release. Because v1.1 tends to revise recent models upward relative to v1.0, re-scoring the most recent Chinese models on v1.1 would likely raise the China frontier and narrow this lag somewhat.
Appendix 2: Translating relative US-China compute access and distillation into months of US lead
This appendix describes how we convert two policy-dependent variables — the compute advantage of US AI companies over Chinese AI companies, and the extent of Chinese distillation of US models — into the expected US lead in frontier AI capability, measured in months. The modeling is high-level and makes many simplifying assumptions, especially about the effects of reinforcement learning (RL) and algorithmic efficiency gains. The results should be understood as a way to measure the high-level impact of different policy interventions, rather than as a highly accurate prediction of the months of lead each intervention gains.
1. Metrics for the lead
We define the US lead as the time between the US frontier first reaching a given ECI score and China’s best model reaching the same score. Based on this definition, the current US lead is 6.5 months.59
To forecast the US lead, we assume that growth in ECI score is a function of “effective compute” (EC). Effective compute is the amount of training compute a model would need to reach its capability level if it were trained with a fixed reference recipe, e.g., the exact algorithms used to train GPT-4. It combines the physical compute a developer uses with efficiency gains, such as better algorithms, data, post-training, and distillation, that give the developer more capability per unit of compute.
2. Creating a model for the lead
We model the US lead as proportional to the logarithm of the ratio of physical training compute used by US vs Chinese frontier labs. This follows a well-established empirical trend: AI capabilities improve roughly linearly with the logarithm of training compute, so each tenfold increase in compute buys a similar capability gain.60 Given this relationship, a fixed model training compute ratio between two actors corresponds to a fixed capability gap in ECI points. Because the frontier advances at a steady rate in ECI points per month, that gap can also be expressed as a number of months.
This approach assumes that US and Chinese AI companies have equal algorithmic efficiency. In other words, the same physical compute buys the same amount of capability in either country. We think this is a reasonable approximation of trends to date. New techniques are likely to spread quickly through publications, open-weight releases, corporate espionage, and researcher mobility, and Chinese labs have frequently published methods matching or adapting those of US labs. If one country does hold a persistent efficiency advantage (which might be likely given US AI companies are increasingly using their compute advantage to automate AI R&D), this model would misstate how sensitive the lead is to relative compute access. We treat this as a key limitation.
We then assume that the US lead is reduced by a share (S) that China recaptures through distillation. This reflects how distillation works. A student model learns from its teacher’s outputs, so it can only recover capabilities the teacher has and the student lacks. The more capable US models are relative to Chinese models, the more capability distillation can transfer, and the larger the absolute gain China gets from it.
This yields a model of the form:
Lead = (1 − S) × K × log10(CR_train)
Where:
- CR_train is the relative amount of physical compute US AI companies allocate to frontier model training relative to Chinese companies, expressed as a multiple.
- K is the months of lead gained per 10x physical training compute advantage, in the absence of adversarial distillation.
- S is the share of lead recaptured by Chinese adversarial distillation.
3. Calibrating the model
We can now derive values for each of the key terms in our model:
- Lead: The current observed US lead is 6.5 months.61
- S: A senior Anthropic executive recently estimated the current US lead at 6 to 9 months, rising to 12 to 18 months if Chinese firms were not able to conduct adversarial distillation of US models. Applied to our 6.5-month estimate, this implies a lead of about 13 months without distillation. Distillation therefore recaptures S = 6.5 ÷ 13 = 0.5 of the lead. An independent estimate from DeepSeek’s distillation experiments gives a similar value, S ≈ 0.51 (see below).
- CR_train: A forthcoming report (Pilz, 2026) measures total compute differences at an average of 16x across the top five labs from each country, as of the end of 2026. We assume this ratio also holds for the compute labs allocate to training.62
- K: Combining the above values, a 16x compute advantage produces a 13-month lead without distillation, so K = 13 ÷ log10(16) ≈ 10.8 months of lead per 10x of physical training compute advantage. We sanity-check this value below.
These values yield the following formula for modeling the effects of policies that intervene on S or CR_train:
Lead = (1 − S) × 10.8 × log10(CR_train)
Checking S (share of lead recaptured by Chinese adversarial distillation)
We can estimate S independently using a same-base-model comparison between distillation and a student doing its own RL. DeepSeek-R1 (Guo et al., 2025) provides one. It trains the same base model (Qwen2.5-32B) either with its own large-scale RL or by fine-tuning on 800,000 reasoning samples generated by DeepSeek-R1 (the teacher). These samples are likely similar to what Chinese companies can extract when distilling US models behind an API: text responses and chain-of-thought reasoning. Converting each benchmark score into ECI points using regressions of Epoch’s ECI on each benchmark’s score suggests that distillation closed 3.35 of the 6.55 ECI points separating the student from its teacher, so S ≈ 3.35 ÷ 6.55 ≈ 0.51, closely matching our calibrated value of 0.5.63 This should not be taken as a robust validation, given that DeepSeek’s experimental conditions likely do not mirror current typical conditions for distillation (e.g., student vs teacher model size, numbers of samples, distillation techniques).
Checking K (months of lead gained per 10x physical training compute advantage)
To check that K is plausible, we translate it into ECI points and effective compute. The US frontier currently advances by 15.7 ECI points per year (Appendix 1). A lead of 10.8 months therefore corresponds to 10.8 × 15.7 ÷ 12 ≈ 14.1 ECI points per 10x of physical training compute advantage.
We compare this with how much capability comes from scaling pretraining compute alone, using Ho et al. (2025), who find that model capability scales with compute as follows:
C = k × ln(training FLOP) + b
k is estimated from model families trained with a common recipe at different sizes (the Llama, Llama 2, and Llama 3.1 families), so the relationship applies to effective compute. Ho et al. report an average of 0.387 capability units per 10x of effective compute. We convert the paper’s capability units into ECI points using ECI’s methodology, which anchors the ECI scale at Claude 3.5 Sonnet (June 2024) = 130 and GPT-5 = 150. The paper estimates these two models’ capabilities at 1.81 and 2.65, respectively, so one capability unit equals 20 ÷ (2.65 − 1.81) = 23.8 ECI points. This gives 0.387 × 23.8 ≈ 9.2 ECI points per 10x of effective pretraining compute.
Pretraining scaling therefore accounts for about 9.2 of the 14.1 ECI points per 10x of physical training compute advantage explained by our model. We attribute the remaining ~4.9 points to capability gains beyond pretraining that also grow with a compute advantage: reinforcement learning, larger models making better use of test-time reasoning, and other methods that become more effective at scale. We assume both countries devote the same share of compute to these. Expressed as effective compute, these gains add 4.9 ÷ 9.2 ≈ 0.53 orders of magnitude for each 10x of physical compute, so effective compute scales as CR_train^1.53.
4. Scoring interventions
Because distillation recaptures a share S of the US lead, increasing the US compute advantage and preventing distillation reinforce each other. While distillation continues, China claws back about half of any gain in US compute advantage, so a 10x increase in CR_train adds only (1 − S) × 10.8 ≈ 5.4 months of lead, versus ~10.8 months if distillation is stopped. Conversely, preventing distillation becomes more valuable the larger the US compute advantage is, because a larger advantage leaves more capability for distillation to transfer: stopping distillation adds S × 10.8 × log10(CR_train) months, which is about 6.5 months at CR_train = 16x but 10.8 months at CR_train = 100x.
A compute intervention changes CR_train, for example by allowing or blocking chip sales that change Chinese companies’ compute. We assume that changes in the total compute ratio between the US and China proportionally affect CR_train; that is, the relative concentration of each country’s compute in its frontier labs stays constant over time and is unaffected by interventions.
A distillation intervention reduces S by reducing the quantity of data Chinese distillers can harvest from US models, for example through industry coordination to detect and block distillation, hiding chain-of-thought, or legal deterrence. Because the capability gained from distillation scales with the logarithm of the data harvested, we model a cut of a fraction c in harvested data as reducing S by 0.25 × log10(1 ÷ (1 − c)) × S.64
To recap, the model makes several key assumptions:
- Distillation recaptures a constant share of the lead caused by differing compute access.
- Chinese and US AI companies have equal algorithmic efficiency.
- Chinese AI companies can distill the capabilities of US models as soon as they are released.
- Both countries spend roughly the same share of compute on RL and other post-training.
- The relative concentration of each country’s compute in its frontier labs stays constant and is unaffected by interventions.
The table below gives the months of lead each possible intervention adds, based on our estimated current CR_train ≈ 16x.
| Intervention | Months of lead added | Estimate |
|---|---|---|
| Change compute advantage from CR_train to CR′_train, distillation ongoing | (1 − S) × 10.8 × log10(CR′_train / CR_train) | 5.4 per 10x change |
| Change compute advantage, distillation fully stopped | 10.8 × log10(CR′_train / CR_train) | 10.8 per 10x change |
| Stop distillation fully | S × 10.8 × log10(CR_train) | 6.5 at CR_train = 16x |
| Cut data harvested by distillers by a fraction c | 0.25 × log10(1 ÷ (1 − c)) × S × 10.8 × log10(CR_train) | 1.6 for a 90% cut and 3.3 for a 99% cut, at CR_train = 16x. |
Appendix 3: Estimating ASML’s 2026 DUV immersion sales to China
The Center for Technology and Statecraft (CTS) estimates that approximately 270 ASML NXT:1980i DUV immersion (DUV-i) systems were installed in Chinese-owned fabs as of Q1 2026.65 Of these 270 systems, CTS estimates that 10-11 were imported in Q1 2026.
Using ASML filings and earnings calls, we estimate a further 54 DUV-i systems were/will be sold to China between Q2 and Q4 in 2026, leading to an estimated fleet of ~322 NXT:1980i systems in Chinese-owned fabs by end-2026.66 As ASML does not disclose the exact number of DUV-i systems sold to China, we use the following procedure for our estimate, using the known dollar value of ASML’s sales to China in 2026:
- We assume that China’s purchases from ASML are exclusively DUV systems (both immersion and non-immersion), since US and Dutch export restrictions have restricted more advanced EUV sales to China since 2019.67
- We calculate a “ceiling” for DUV-i system sales to China, by assuming that across 2026, China bought/will buy the average global product mix of DUV immersion vs. non-immersion systems from ASML. The ceiling implies that China acquired 70 DUV-i systems from ASML in 2026 (54% of ASML’s DUV-i sales).
- We calculate a “floor” for DUV-i system sales to China, by assuming that China bought all of ASML’s non-immersion DUV systems. Given assumption 1, the remaining dollar value of ASML sales to China must thus be spent exclusively on DUV-i systems. The floor implies that China acquired 54 DUV-i systems from ASML in 2026 (42% of ASML’s DUV-i sales).
- Given that DUV-i system sales to China are less than half of ASML’s DUV-i system sales (reflecting information from ASML’s Q1 2026 earnings call stating that DUV-i sales “remain primarily non-China”), we take the midpoint of the floor and ceiling, implying that China acquired ~62 DUV-i machines from ASML in 2026 (47% of ASML’s DUV-i sales). This midpoint implies China acquired ~77% of ASML’s non-immersion DUV sales (by revenue).
Our per-period analysis for 2026 with sources can be found in the table below.
| Period | ASML’s global DUV-i sales (units) | ASML’s global DUV revenue | ASML’s DUV revenue from China | DUV-i sales to China, floor (units) | DUV-i sales to China, ceiling (units) | Mid point |
|---|---|---|---|---|---|---|
| Q1 | 1768 | €2.0B69 | €1.2B70 | 771 | 1072 | 8 |
| Q2 | 2373 | €2.6B74 | €0.9B75 | 276 | 877 | 5 |
| H2 | 9078 | €8.9B79 | €5.1B80 | 4481 | 5282 | 48 |
| Total | 130 | €13.5B | €7.2B | 53 | 70 | 6283 |
Appendix 4: Estimating China’s stock of domestically produced AI chips
To obtain an estimate of China’s domestically produced AI chip stock in 2026 and 2027, we first estimate Chinese AI chip production in each year, and then add the results to China’s existing stock as of the end of 2025. The results are summarized in the chart below.
Estimating Chinese AI chip production
China’s access to DUV-i systems (~260 by end of 2025, ~324 by end of 2026) dictates an upper limit on the number of AI chips that Chinese semiconductor companies can produce, assuming no other constraints. In practice, Chinese domestic AI chip production is severely constrained by its access to high-bandwidth memory (HBM). We estimate that China will produce 986,000 H100-eq (range: 662,000 to 1.4 million) in 2026, and 1.3 million H100-eq (range: 840,000 to 2.1 million) in 2027, using the following procedure:
- Estimate a limit on production based on DUV-i access.
- Estimate a further limit on production based on HBM availability.
- Take the lower of the two estimates as our practical upper limit on Chinese AI chip production each year.
Upper limit based on DUV-i access
CTS estimates China’s AI chip production capacity assuming that DUV-i system access is the only meaningful constraint on production.
For 2026, it estimates 1 million H100-eq in production on the current trend, and 4 million H100-eq in an “AI push” scenario, where China prioritizes AI chips in its DUV-i fleet, reaching the same allocation forecasted in the US ecosystem.
For 2027, it estimates 2 million H100-eq on the current trend, and 11 million H100-eq in an AI push scenario.
Practical limit based on HBM availability
Limited supply of HBM is the binding constraint on China’s AI chip production. Somala (2026) estimates the quantity of AI chips Huawei can produce by combining the following channels:
- Huawei’s use of domestic HBM production for Ascend chips from Chinese companies CXMT and XMC in 2026 and 2027.
- Huawei’s use of stockpiles of foreign HBM (10 million stacks built up before December 2024 export controls on HBM).
- Huawei’s use of additional smuggled foreign HBM to produce Ascend chips in 2025 and 2026.
- Huawei’s lower-bandwidth memory alternatives production in 2025 and 2026, which can be used to produce less performant AI chips.
We supplement this data by applying our own H100-eq conversions,84 estimating additional foreign HBM smuggling in 2027, and adding production from other Chinese AI chip design companies. Our estimates are summarized in the following table, with footnotes detailing our methodology.
| Channel | Chip models | Chips produced (units), 202685 | H100-eq, 202686 | Chips produced (units), 202787 | H100-eq, 202788 |
|---|---|---|---|---|---|
| Huawei: Domestic HBM (CXMT + XMC) | 950DT (2026, 2027), 960DT (2027) | 239K (101K to 404K) | 121K (51K to 204K) | 483K (185K to 953K) | 348K (136K to 682K) |
| Huawei: Foreign HBM stockpile | 910C (2026) | 428K (138K to 778K) | 325K (105K to 591K) | 0 | 0 |
| Huawei: Additional foreign HBM smuggled | 950DT (2026, 2027), 960DT (2027) | 79K (54K to 123K) | 40K (27K to 62K) | 161K (105K to 273K) | 116K (77K to 194K) |
| Huawei: Non-HBM memory | 950PR (2026, 2027) | 500K (250K to 750K) | 253K (126K to 379K) | 862K (394K to 1.6M) | 436K (199K to 807K) |
| Cambricon | Siyuan 590 (2026, 2027) | 215K (191K to 300K) | 56K (50K to 78K) | 371K (191K to 600K) | 96K (50K to 155K) |
| Other Chinese AI chip designers | Chips from T-Head, Kunlunxin, Hygon, MetaX, Enflame, Biren, Iluvatar CoreX, Moore Threads | 857K (562K to 1.1M) | 191K (96K to 383K) | 1.3M (562K to 2.2M) | 299K (149K to 598K) |
| Total | 2.3M (1.8M to 2.8M) | 986K (662K to 1.4M) | 3.2M (2.2M to 4.8M) | 1.3M (840K to 2.1M) |
These estimates suggest that China’s domestic AI chip production will be around 986,000 H100-eq in 2026, and 1.3 million in 2027. Both fall below the upper limit imposed by DUV-i system output (1 million and 2 million, respectively, on China’s current path) for each year.
China’s total access to domestically produced AI chips
To obtain China’s total stock of domestic AI chips in each year, we add our 2026 and 2027 production values to China’s existing stock of domestic AI chips as of Q4 2025. We obtain this from Epoch’s AI chip sales data. Our central estimates are as follows:
- End of 2025: 743,000 H100-eq (597,000 to 945,000)
- End of 2026: 743,000 + 986,000 = 1.7 million H100-eq (1.4 million to 2.2 million)
- End of 2027: 1.7 million + 1.3 million = 3 million H100-eq (2.3 million to 4.2 million)
Appendix 5: Estimating China’s legal imports of AI chips
We estimate that the cumulative stock of legally imported AI chips in China reaches about 846,000 H100-eq (range: 674,000 to 1.02 million) by the end of 2026, and about 1.35 million H100-eq (range: 986,000 to 2.04 million) by the end of 2027.
| Year | Chip designer, architecture, and units | H100-eq, central | H100-eq, low | H100-eq, high |
|---|---|---|---|---|
| 2022 | NVIDIA A100 (72,696) + A800 (28,132) | 31,791 | 21,634 | 47,054 |
| 2023 | NVIDIA A800 (93,286) + H800 (115,429) | 144,842 | 115,616 | 181,800 |
| 2024 | NVIDIA H20 (958,410) | 143,348 | 110,290 | 186,483 |
| 2025 | NVIDIA H20 (474,712) + AMD MI308X (31,859) | 81,525 | 61,276 | 107,760 |
| 2026 | NVIDIA H200 (100,000; range 20,000–200,000) | 100,000 | 20,000 | 200,000 |
| 2026 (RTX cards) | NVIDIA RTX Pro 6000D, RTX Pro 5000, RTX 5090D (1.2M cards; range 1.0M–1.5M) | 344,400 | 219,745 | 424,233 |
| 2027 (H200s) | NVIDIA H200 | 200,000 | 20,000 | 875,000 |
| 2027 (RTX Pro 5500) | NVIDIA RTX Pro 5500 (~1,000,000 cards; >2M reportedly ordered) | 300,000 | 0 | 600,000 |
Imports up to 2025
We estimate legal imports through 2025 using Epoch AI’s data on AI chip owners, which estimates the AI chips held by Chinese firms by chip type and quarter (Epoch AI). By the end of 2025, the US AI chips legally sold to China were the NVIDIA A100, A800, H800, and H20, and the AMD MI308X. We make the following adjustments:
- H20s: For 2025 we start from Epoch’s 531,486 H20s, remove the $650 million of H20s NVIDIA reported selling to a customer outside China (NVIDIA), and add the roughly $60 million NVIDIA later earned from licensed H20 sales to China (NVIDIA 10-K). Both adjustments are converted to units at $10,392 per chip, leaving 474,712 H20s.
We convert units to H100-eq using dense 8-bit throughput relative to the H100’s 1,979 dense FP8 TFLOP/s. For chips without FP8 we use INT8. This gives the A100 and A800 0.315 H100-eq (624 TOPS dense INT8), the H800 1.0, the H20 0.15 (296 TFLOP/s dense FP8), and the MI308X 0.33 (654 TFLOP/s dense FP8).
In total, legal imports through 2025 come to about 402,000 H100-eq. Our range (309,000 to 523,000) adds Epoch’s 5th- and 95th-percentile estimates for each chip, which assumes every chip’s estimate errs in the same direction.
Imports in 2026
We estimate 2026 legal imports from two channels: licensed NVIDIA H200s and export-compliant NVIDIA gaming and workstation cards.
- H200s: Licensed H200 shipments to China began in July 2026 under a January 2026 Commerce Department rule allowing case-by-case licenses for chips up to H200 performance (Federal Register). ByteDance and Tencent had each received about 10,000 H200s by mid-August (Financial Times (FT)). Assuming deliveries continue through year-end, we estimate 100,000 H200s, with a range from 20,000 (reported deliveries only) to 200,000.
- Gaming and workstation cards: Chinese firms had bought more than 1 million NVIDIA cards that comply with US export controls by mid-October 2026, mostly the RTX Pro 6000D, RTX Pro 5000, and RTX 5090 (Financial Times). The full RTX 5090 exceeds US export-control thresholds, so we take the FT’s reference to mean the export-compliant RTX 5090D sold in China.89 Since the FT’s figure is a lower bound covering only part of the year, we assume 1.2 million cards for the full year, with a range of 1.0 million (purchases stop at the reported level) to 1.5 million (purchases continue at their pace so far, plus some upside). The FT gives no breakdown by model, so our central case splits purchases equally across the three. Beijing instructed major tech firms to stop buying the RTX Pro 6000D in September 2025 and blocked imports of the RTX 5090D V2 in May 2026, but the FT reports that purchases of these models continued.90
For per-card performance we use dense FP8 throughput from NVIDIA’s architecture whitepapers, scaled to the China-specific variants for which NVIDIA does not publish figures (NVIDIA RTX PRO Blackwell; NVIDIA GeForce RTX Blackwell). Because the FT reports that these cards comply with US export controls, we cap each card at the threshold below which non-data center chips are exempt from control: a total processing performance (TPP) of 4,800, equivalent to 600 TFLOP/s of dense 8-bit throughput, or 0.303 H100-eq.91 This gives:
- RTX Pro 6000D: 0.30 H100-eq. NVIDIA does not publish figures for this card. Scaling the RTX Pro 6000 (1,008 TFLOP/s dense FP8) by the 6000D’s reduced core count gives about 776 TFLOP/s, but this would exceed the 4,800 TPP threshold, so we assume NVIDIA capped it near the threshold, as it did with the RTX 5090D. In our low case we use 0.15, in case the card is classed as a data center chip, which would subject it to a lower threshold.
- RTX Pro 5000: 0.26 (516 TFLOP/s).
- RTX 5090D: 0.30 (594 TFLOP/s with FP16 accumulation). GeForce cards run FP8 at half rate with FP32 accumulation, giving 0.15 H100-eq.
An equal mix averages 0.29 H100-eq per card. Our low case uses 0.19, assuming FP32-accumulation rates for the RTX 5090D and the lower RTX Pro 6000D value. Our high case uses 0.30, assuming all cards sit at the export-control threshold. Combining volumes and performance in a simulation gives about 344,000 H100-eq (range: 220,000 to 424,000) from these cards. This figure overstates the cards’ usefulness for some tasks. They are weaker than Huawei’s Ascend 910C, and the FT reports they are used mainly for simpler workloads such as the prefill stage of inference, which depends on compute and suits an FP8-based comparison. For decoding, which depends on memory bandwidth, their GDDR7 memory puts them further behind. Further, these cards lack the high-speed interconnect needed for large-scale training.
In total, legal imports in 2026 come to about 444,000 H100-eq (range: 301,000 to 566,000). Ranges for the 2026 and 2027 totals combine channels in a joint simulation, so they are narrower than the sum of the individual channel ranges. Including chips acquired in earlier years, China’s cumulative legally imported stock reaches about 846,000 H100-eq by the end of 2026 (range: 674,000 to 1.02 million).
Imports in 2027
We estimate 2027 legal imports from two channels: continued licensed NVIDIA H200 sales and NVIDIA’s forthcoming RTX Pro 5500 workstation card. Both are speculative and depend on decisions in Washington and Beijing.
- H200s: We assume 200,000 H200s, with a range from 20,000 to 875,000. Our high case assumes every potentially approved buyer purchases up to its cap, about 975,000 H200s across 2026 and 2027.92 Actual volumes also depend on Beijing’s guidance to Chinese firms.
- RTX Pro 5500: Chinese firms have reportedly indicated orders for more than 2 million RTX Pro 5500s, a new NVIDIA workstation card expected to outperform its current China offerings, with shipments starting as early as the end of 2026 (Financial Times). Chinese regulators are reportedly reviewing whether this demand is necessary, and the card would also need to stay within US export controls. We assume about 1 million cards are delivered in 2027, roughly half of reported orders, with a range from zero (if Chinese or US authorities block sales) to 2 million (all orders delivered).
NVIDIA has not published compute figures for the RTX Pro 5500. The card uses a cut-down version of the same chip as the RTX 5090, with the same number of CUDA cores (21,760). NVIDIA rates the RTX 5090 at 838 TFLOP/s dense FP8 (NVIDIA GeForce RTX Blackwell), or 0.42 H100-eq, but this exceeds the 4,800 TPP export-control threshold. If the RTX Pro 5500 ships without a license, its compute must sit below that threshold, so any performance gain over existing China offerings likely comes from memory rather than compute. We therefore assume 0.30 H100-eq per card, in line with the RTX 5090D. That gives about 300,000 H100-eq (range: 0 to 600,000). If US authorities instead licensed a higher-performance version case by case, as with the H200, volumes at the RTX 5090’s 0.42 H100-eq would add about 40% to these figures.
As with the 2026 gaming and workstation cards, these figures overstate the cards’ usefulness for some tasks: their GDDR7 memory has well under half the bandwidth of an H100, and they lack the interconnect needed for large-scale training.
In total, legal imports in 2027 come to about 500,000 H100-eq (range: 179,000 to 1.18 million). Including chips acquired in earlier years, China’s cumulative legally imported stock reaches about 1.35 million H100-eq by the end of 2027 (range: 986,000 to 2.04 million).
Appendix 6: Estimating reductions in AI chip smuggling to China
Using customs data compiled by Epoch, we search for origin countries for AI server imports to China that show signs consistent with smuggling. We use the following criteria:
- China booked server imports worth more than $100 million over the observation period.
- After October 2023 export controls, value of servers imported and the average price per server surged by at least 3x the previous baseline.
- During the surge, the number of servers recorded as imported by China roughly matches the number the origin declared exporting, but China’s value per server exceeded that declared by the origin by at least 2x.
We find that server imports from two countries match these criteria: Malaysia (consistent with the trend observed by Epoch), and Singapore. Both countries are known AI chip smuggling hotspots. Between H1 2025 and H1 2026 (the latest observable period in the customs data), the total value of servers imported into China from each country averaged an 81.9% decline (Malaysia: 80.7%, Singapore: 83.1%).
Appendix 7: Estimating China’s overseas AI compute access in 2026 and 2027
We estimate that Chinese entities could access ~1.05 million H100-eq of AI compute overseas by the end of 2026, rising to ~2.8 million by the end of 2027.93 Our 10th–90th percentile range, derived from a Monte Carlo simulation, runs from ~680,000 to ~1.46 million H100-eq in 2026 and from ~1.97 million to ~3.9 million in 2027.94
| 2026, H100-eq (FP8) | 2026, H100-eq (FP8) | 2027, H100-eq (FP8) | 2027, H100-eq (TB/s) | |
|---|---|---|---|---|
| Lower bound (P10) | 680,642 | 769,928 | 1,966,870 | 1,793,936 |
| Central estimate95 | 1,054,277 | 1,049,400 | 2,834,351 | 2,457,096 |
| Upper bound (P90) | 1,455,457 | 1,536,331 | 3,905,214 | 3,477,101 |
We combine two sources for our estimates:
- Specific identified clusters, using media reporting and company filings.
- SemiAnalysis’s Chinese hyperscaler overseas leasing data. SemiAnalysis estimates the data center capacity Chinese hyperscalers lease overseas (including for housing non-AI hardware), but excludes GPUs they rent from Western clouds and neoclouds.
Our final estimate adds our AI estimates from SemiAnalysis’s capacity to the identified clusters it excludes, which we previously obtained from the first source above. We then extend this methodology to 2027.
Our central estimate for 2026 is similar to ChinaTalk’s 2026 median estimate of ~1.03 million H100-eq (FP8) (April 2026) and well above IAPS’s ~670,000 H100-eq floor (TPP) (May 2026). The main difference is in composition: we draw on SemiAnalysis’s September 2026 leasing data and add clusters neither estimate includes,96 but we weight the AI content of older leases down and count ByteDance’s directly leased capacity in Singapore, Johor, and Batam through SemiAnalysis’s data rather than as a fully AI cluster.
Source 1: 2026 cluster-by-cluster estimate
We identify GPU clusters that media reporting or company filings attribute to a Chinese customer. We include a cluster only if reporting gives a specific GPU count, server count, value, or capacity figure. We convert each into H100-eq using the chip conversion factors and architecture power assumptions outlined at the end of this appendix. Where a source gives MW capacity instead of GPU counts, we convert using per-GPU system power and non-server IT overheads appropriate for each assumed chip. Our full list of clusters, sources, sizing assumptions, and H100-eq can be found in this Google Sheet. We show our sizing of example clusters — including Tencent x Oracle, ByteDance x Oracle, and ByteDance x Nscale — in the main text of this report.
We sort clusters using two categories:
- Our confidence that a cluster is operational and servicing a Chinese customer. Our floor includes clusters that were recently confirmed operational, or whose equivalent capacity we expect a Chinese offtaker to still use by year-end 2026 or 2027.97 Clusters that are delayed, unconfirmed, or lack clear evidence are left out of the central estimate for 2026 and enter the simulation as probabilities. Where we expect them to be operational by year-end 2027 they are in the 2027 central estimate.
- Whether we believe they overlap with Source 2. SemiAnalysis’s leasing data covers capacity Chinese hyperscalers control directly, including facilities leased from developers such as DayOne and Bridge Data Centres and hardware rented from intermediaries such as Megaspeed. It excludes rentals from Western clouds and neoclouds. We add only clusters outside SemiAnalysis’s scope to our final estimate. We list clusters inside its scope for reference but do not count them, to avoid double counting.98
Examples of clusters we size in the 2026 and/or 2027 floor estimate are ByteDance x Nscale (~5,800 H100-eq), Tencent x Oracle (~452,000 H100-eq),99 and Tencent x Datasection’s Japan (~12,800 H100-eq) and Australia (~25,300 H100-eq) sites. We assume reported clusters remain active and their capacity continues to serve Chinese customers, even if the exact customer has changed since reporting.
These clusters are not a comprehensive list of Chinese-linked sites that may hold GPUs. We do not separately count facilities where Chinese hyperscalers lease directly from developers (or via an undisclosed cloud provider), such as Chinese-linked developers including DayOne and Bridge Data Centres, both of which are large lessors to ByteDance. SemiAnalysis’s leasing data captures these in Source 2. Examples of such capacity include DayOne Thailand (up to ~97,000 H100-eq of capacity)100 and ByteDance x Omnia in Brazil (~56,000 H100-eq of capacity by year-end 2027).101
Source 2: SemiAnalysis’s Chinese hyperscaler overseas leasing
SemiAnalysis estimates that Chinese hyperscalers lease nearly 2 GW of overseas data center capacity in 2026, rising to ~3.2 GW in 2027.102 These figures include non-AI capacity such as CPUs and storage. SemiAnalysis reports them as critical IT capacity at year-end; it is unclear whether this measures contracted or expected delivered capacity. We assume it will be fully delivered in our central estimate, and vary the energization of each year’s new leases between 65% and 100% in our simulation.103 Based on public writing and correspondence with SemiAnalysis, we understand these leases to exclude Western cloud and neocloud services, and to include capacity where a Chinese hyperscaler controls the deployment, likely through two kinds of arrangements:
- Facilities leased directly from data center developers, such as DayOne and Bridge Data Centres, where the Chinese hyperscaler is the tenant and installs its own equipment. Here, export controls on advanced GPUs should ensure hyperscaler-owned hardware is compliant.104
- Dedicated GPU hardware rented from intermediaries, such as Megaspeed.105 In this case, the intermediary buys the chips and exclusively rents them to the hyperscaler. This resembles ownership, but the hardware stays off the hyperscaler’s balance sheet (for public companies) and lets the hyperscaler access restricted GPUs. Conversations with industry experts indicate that this is the dominant form of Chinese hyperscaler leasing arrangements, outside of neocloud or Western cloud partnerships.
We make two adjustments to SemiAnalysis’s data:
First, we apply expected AI shares, weighted by when leases were signed. SemiAnalysis’s figures include non-AI capacity, so we estimate the share that serves AI using regional AI shares from a separate forthcoming analysis of global data center buildout (Pilz 2026). That analysis estimates the share of data center capacity brought online expected to serve AI workloads for each region and year from 2023 to 2026, derived from named AI deployments, operator and tenant disclosures, and trade data.106 For the SemiAnalysis data, we back out each year’s new leases from the change in the region, and assume each year’s additions reflect the AI share of all capacity added in that region for that year. This assumes that Chinese hyperscalers’ leasing broadly corresponds to each region’s AI buildout in a given year (i.e. Chinese hyperscalers lease the same mix of AI and non-AI capacity that the broader region is building).107 Weighting by lease year matters most in the US and Latin America, because most Chinese hyperscaler capacity was leased in those regions in 2020–2023 for TikTok and little has been added since.108 For capacity leased before 2023, we assume 10%.109 Capacity added in 2027 uses the 2026 share, as we have insufficient data to derive separate 2027 estimates. We find the historically weighted AI shares for each region and year by summing the AI capacity of every lease held at year end (with each lease counted at the AI share for the year it was added), divided by total leased capacity at year end.
For each region we define:
All capacity leased before 2023 is treated as a single vintage, with a₂₀₂₂ = L₂₀₂₂ and s₂₀₂₂ = 10%. Capacity added in 2027 uses the 2026 share, so s₂₀₂₇ = s₂₀₂₆.
So that:
To allow for leases that are signed but not yet energized, we also define:
110
So that:
Here, leases in the prior year-end stock count in full at their own historical AI share, and only the current year’s new leases are discounted by e.
Second, we adjust AI shares for clusters that SemiAnalysis excludes. Our regional AI shares describe all data center capacity in a region, including the GPU-dense Western cloud and neocloud capacity that SemiAnalysis’s leasing figures exclude (counted separately). Applying the regional share directly to SemiAnalysis’s leases and then adding the clusters on top would therefore overstate AI capacity. Instead, we apply the regional share to all capacity Chinese entities use in a region, i.e., SemiAnalysis’s leases plus the clusters we identify. We then assign to SemiAnalysis’s leases only the AI capacity those clusters don’t already account for. To do so, we define:
So that:
Here, R × (S + C) is the total AI capacity Chinese entities use in the region, and the AI capacity of the identified clusters is the portion we already count through specific clusters. For example, in Southeast Asia in 2026, S = ~1,168 MW (~632 MW leased by year-end 2025, plus ~536 MW added in 2026) and R = 50.045%. Our identified clusters in the region total C = 255.7 MW, of which roughly 206.7 MW is AI capacity, mostly ByteDance x Oracle Singapore/Johor/Batam (SJB) at 196 MW AI out of a 245 MW total footprint.111 This gives Aₛ = 0.50045 × 1,423.7 − 206.7 = 505.8 MW and AdjS = 43.3%.112 Where we identify no clusters outside SemiAnalysis’s scope, we set AdjS = R. We show our adjusted regional values for our central estimate:
| Region | s_2026 (P50)113 | R_T, 2026114 | AdjS, 2026115 | R_T, 2027 | AdjS, 2027116 |
|---|---|---|---|---|---|
| Southeast Asia117 | 52% | 50.0% | 43.3% | 50.8% | 40.2% |
| Rest of Asia-Pacific ex-China118 | 35% | 29.5% | 29.5% | 31.7% | 27.1% |
| EMEA | 56% | 41.6% | 39.8% | 49.0% | 48.2% |
| US + Latin America | 84% | 26.4% | 26.4% | 37.9% | 37.9% |
After applying these AI share adjustments, SemiAnalysis’s capacity estimates are approximately:119
| Region | Chinese leased AI capacity (2026, MW) | Chinese leased AI capacity (2027, MW) |
|---|---|---|
| Southeast Asia | 505.8 | 794.2 |
| Rest of Asia-Pacific | 86.0 | 134.1 |
| EMEA | 55.7 | 135.0 |
| US + Latin America | 100.4 | 180.0 |
| Year-end total | 748.0 | 1,243.3 |
SemiAnalysis indicated that Chinese hyperscalers generally control the hardware in these halls but keep it off balance sheet, and that whether an arrangement is counted as a lease or a service can change with accounting treatment up until the capacity goes live. Our central estimate assumes this AI capacity holds export-controlled GPUs like NVIDIA’s Hoppers and Blackwells, which implicitly treats most of it as rented hardware from intermediaries (or else acquired via shell companies, subsidiaries, or other hard-to-trace financial arrangements).120 We convert AI capacity using NVIDIA’s 2026 installed-base mix from Epoch AI’s chip sales data (units), weighted per chip architecture’s total power draw: 34% H100/H200s, 25% B200, and 42% B300.121 We apply a 1.1 non-server IT overhead for Hoppers and 1.14 overhead for Blackwells (see later section on conversions, inputs, and assumptions). This yields 774,667 H100-eq on an FP8 basis and ~781,128 on a TB/s basis.
Final estimate for year-end 2026
Our best estimate adds SemiAnalysis’s leasing capacity (Source 2) to the identified clusters it excludes (Source 1). Because we adjust the AI shares for those clusters and leave out clusters already within SemiAnalysis’s scope, the two components do not overlap.
| Component | H100-eq (FP8) | H100-eq (TB/s) |
|---|---|---|
| SemiAnalysis leasing using Hopper/Blackwell mix122 | 774,667 | 781,128 |
| Clusters outside SemiAnalysis’s scope | 279,609 | 268,271 |
| Best estimate | 1,054,277 | 1,049,400 |
| Low (P10) | 680,642 | 769,928 |
| High (P90) | 1,455,457 | 1,536,331 |
About a quarter of this compute comes from Western and neocloud rentals that we can identify, the vast majority servicing ByteDance. As a rough cross-check on our central figures, we estimate renting ~1.05 million H100-eq a year could cost approximately $7.8 billion (range: ~$5.8 billion to ~$14.8 billion), broadly consistent with observable spending.123
The chip architecture mix in this leasing capacity is a large sensitivity to this analysis. For example, a 50/50 theoretical mix of NVIDIA H20s and H100s would lower our estimate to ~598,000, while an all-Blackwell mix raises it to ~1.2 million.124 The simulation treats this mix as uncertain, drawing the share of leased AI capacity on compliant or legacy chips (H20-class) from a range with a median of 5% (1–35%, 10th–90th percentile) and the Blackwell share of the rest from 50–85%; together with the Southeast Asia AI share, these inputs account for most of the width of our 80% interval (see Appendix 7a).
Estimate for year-end 2027
We apply the same methodology used for 2026 to 2027. We use SemiAnalysis’s 2027 leasing forecast (~3.2 GW), with AI shares adjusted for the clusters it excludes, then add back those clusters at the end. The largest new cluster is Tencent’s 100,000-GPU lease from Oracle.
| Component | H100-eq (FP8) | H100-eq (TB/s) |
|---|---|---|
| SemiAnalysis leasing (2026 Hopper/Blackwell mix + 2027 additions using Rubin ramp) | 1,973,281 | 1,710,193 |
| Clusters outside SemiAnalysis’s scope125 | 861,070 | 746,903 |
| Best estimate | 2,834,351 | 2,457,096 |
| Low (P10) | 1,966,870 | 1,793,936 |
| High (P90) | 3,905,214 | 3,477,101 |
We apply the same AI share method to SemiAnalysis’s 2027 forecast, giving ~1,243 MW of AI capacity, ~495 MW more than in 2026.126 We hold 2026 capacity at its 2026 Hopper/Blackwell mix and assume capacity added in 2027 uses a mix of Blackwells and next-generation Vera Rubins.127 This gives ~1.97 million H100-eq (FP8) and ~1.71 million H100-eq (TB/s) in 2027.
Conversions, inputs, and assumptions for our calculations
Chip conversion factors
We present figures in H100-eq on a dense FP8 basis, the metric most relevant to training. Where relevant, we also show memory bandwidth (TB/s), more relevant to inference, and total processing performance (TPP), for comparability with other estimates.128 We use the following conversions between chips:
| Chip | Dense FP8 | H100-eq (FP8) | Mem BW (TB/s) | H100-eq (TB/s) |
|---|---|---|---|---|
| A100 | 624 (INT8) | 0.315 | 2 | 0.597 |
| H20 | 296 | 0.1496 | 4.0 | 1.194 |
| H100 | 1,979 | 1.00 | 3.35 | 1.00 |
| H200 | 1,979 | 1.00 | 4.8 | 1.43 |
| B200129 | 5,000 | 2.527 | 8 | 2.388 |
| B300 | 5,000 | 2.527 | 8 | 2.388 |
| Vera Rubin130 | 17,500 | 8.843 | 22 | 6.567 |
Neither NVIDIA nor Epoch breaks out H100 from H200 sales. This does not affect FP8 or TPP conversions, which are identical, but it does affect memory bandwidth, where the H200 is 1.43x the H100. For converting to H100-eq on a memory bandwidth basis, we assume 50% are H100s and 50% are H200s.
Assumptions for converting data center power capacity into H100-eq
Per-GPU power is derived from system-level peak draw reported by NVIDIA spec sheets, outlined below. We convert critical IT capacity to GPU counts using system-level power at full load, divided by the number of GPUs per system:
- 8-GPU H20 server: 7.8 kW (estimated)131
- Implied per H20 GPU: 975 watts
- 8-GPU DGX H100/H200: 10.2 kW
- Implied per H100/H200 GPU: 1,275 watts
- 72-GPU GB200 NVL72: 120 kW
- Implied per B200 GPU (in NVL72 form factor): 1,667 watts
- 72-GPU GB300 NVL72: 142 kW
- Implied per B300 GPU: 1,972 watts
- 72-GPU VR NVL72: 180–220 kW (depending on system setup)132
- Implied per VR GPU: 2,500–3,060 watts
These per-GPU figures include CPUs, memory, and in-rack networking, but exclude scale-out networking and shared storage outside the rack. Including that equipment, true cluster counts are lower than a naive per-GPU division implies, so we divide all power capacity figures by a non-server IT overhead factor: 1.10 for Hopper and H20 systems, and 1.14 for Blackwell and Rubin systems.133 Where developers do not specify whether stated capacity refers to critical IT or total facility power, we treat it as total facility power and apply a 1.3 power usage effectiveness (PUE) ratio in line with the reported PUE of comparable facilities.
NVIDIA chip product mixes
Where a data center facility’s chip mix is unknown, we assume its installed base reflects Epoch AI’s cumulative Hopper and Blackwell shipments, renormalized to the H100/H200, B200, and B300 architectures.134 Epoch reports cumulative shipments in compute capacity (H100-eq), chip power (GW), cost (USD), and number of units. To estimate the H100-eq of cluster sizes, we apply different product mixes: for example, for facilities with a stated power capacity we weight units by per-system GPU power, since the quantity is being divided between the chips in watts. This ensures that architectures are accurately represented in our estimates, depending on our methodology.135
| Period | H100 and H200, unit share | B200, unit share | B300, unit share | H100 and H200, power weighted | B200, power weighted | B300, power weighted |
|---|---|---|---|---|---|---|
| 2025 mean (Q1–Q4) | 70.29% | 21.01% | 8.70% | 63.77% | 24.57% | 11.66% |
| 2026 mean (Q1–Q3) | 42.45% | 23.72% | 33.83% | 33.81% | 24.68% | 41.51% |
| Year-end 2025 (Q4) | 55.82% | 24.80% | 19.38% | 47.21% | 27.43% | 25.36% |
| Latest 2026 (Q3) | 39.04% | 22.86% | 38.10% | 30.54% | 23.37% | 46.09% |
We use the 2026 installed-base mix (Q1–Q3 mean, power-weighted) to convert SemiAnalysis’s 2026 capacity, and a mean expected power-weighted Rubin/Blackwell mix (see section below) for capacity added in 2027. Where SemiAnalysis indicates hardware, we follow it, such as GB200s for ByteDance’s Oracle capacity in SJB. These assumptions may undercount capacity where operators have retrofitted existing halls with newer GPUs.
Modeling the Vera Rubin ramp
For clusters built in 2027 (the Tencent x Oracle agreement and SemiAnalysis’s 2027 capacity forecast), we assume some capacity is filled by next-generation Vera Rubins unless otherwise stated.136 We model Rubin’s ramp on the historical transition from Hoppers to Blackwells: in each quarter after mass shipments begin, Rubin takes the same share of new unit sales that Blackwell took from Hopper in the corresponding quarter after Blackwell’s launch.137 Our slower ramp assumes Rubin’s first quarter of mass shipments is Q1 2027; our faster ramp assumes Q4 2026. Because a Rubin GPU draws more power than a B300 (2,500 watts vs. 1,972 watts per GPU), we convert these unit shares into power shares before splitting capacity between chips. We use this ramp for the Tencent × Oracle agreement. Our 2027 estimates from SemiAnalysis data use the mean of this ramp, assuming access to Rubins begins in Q1 2027. This yields a mean product mix of 65% Rubin and 35% Blackwells (we assume B300s) for the Chinese hyperscalers’ AI access via this channel in 2027.
| Quarter | Blackwell reference quarter (historical) | Rubin share of GPUs sold138 | Rubin share of power139 |
|---|---|---|---|
| Q0 | Q3 2024 | 0% | 0.00% |
| Q1 | Q4 2024 | 22.76% | 27.19% |
| Q2 | Q1 2025 | 61.23% | 66.69% |
| Q3 | Q2 2025 | 73.96% | 78.26% |
| Q4 | Q3 2025 | 87.46% | 89.84% |
| Q5 | Q4 2025 | 98.03% | 98.44% |
| Q6 | Q1 2026 | 100% | 100.00% |
-
H100-eq is a way of measuring the available computing performance of a chip or group of chips, based on the number of NVIDIA H100s that would equal the same performance as the chips under consideration. It accounts for differences in chip performance across different models in a single, standardized metric. To calculate H100-eq, we divide a chip’s FP8 dense performance by the H100’s FP8 dense performance. If a chip does not support FP8, we instead use its INT8 or FP16 performance.
-
In this report we use “China” to refer to the People’s Republic of China.
-
See Appendix 1.
-
See Epoch AI’s ECI methodology.
-
Benchmark saturation refers to cases where AI models score near the top of a benchmark, making it harder to tell models apart or track progress. ECI doesn’t rely on any one benchmark, instead inferring a model’s capability from whichever benchmarks still separate models at its level.
-
On SWE-rebench (NeurIPS 2025), which rebuilds SWE-bench (a software engineering benchmark) from GitHub tasks published after each model's training cutoff (so memorization is impossible), DeepSeek-V3-0324's resolve rate falls from 39.7% to 21.3%, a 46% drop and larger than any Llama model tested (24–40%). On LiveCodeBench (ICLR 2025), which contrasts performance on LeetCode (a coding benchmark) problems published before and after a model's training cutoff, DeepSeek-Coder-33B's pass@1 collapses from ~60% on problems published before its training cutoff to ~0% on problems published after it. A third paper, "Training on the Benchmark Is Not All You Need" (Ni et al., AAAI 2025), detects contamination by checking whether a model assigns a higher probability to a multiple-choice question's original answer ordering than to shuffled orderings. It finds signs of leakage on 42% of the questions in CMB (a medical exam benchmark) for Qwen2-72B, and leakage values for the Qwen model family almost ten times those of other model families tested. Similar evidence comes from contamination-resistant private evaluations, where memorization is much more difficult or impossible. On the ARC Prize leaderboard for ARC-AGI-2 (October 2026), the top Chinese models — DeepSeek V4.1 Flash (73%), GLM-5.3-Flash (66%), DeepSeek V4 Pro (61%), and Kimi K3 (60%) — sit far below US frontier models (GPT-6, 95%; Claude Opus 5.5, 93%; Gemini 4 Argon, 91%), and below where US models already were by June 2026 (Claude Fable 5, 89%). The gap is starker on the newer, interactive ARC-AGI-3, where the best US models score 96–100% and the best Chinese model scores 3%.
-
Time horizons measure how well AI models can successfully complete tasks based on the time it would take a human expert to perform the same task. Time horizons in software engineering are highly relevant for a model’s ability to conduct autonomous AI R&D and carry out autonomous cyberattacks. See METR, “Measuring AI Ability to Complete Long Software Tasks” (March 2025).
-
See Appendix 1.
-
For Mythos comparisons, we assess the gap by comparing Mythos’s reported capabilities against the China trendline, rather than between the US and Chinese trendlines. Anthropic recently released a blog post measuring the cyber capabilities of the Chinese model GLM-5.3 as approaching those of Mythos.
-
Recently, OpenAI announced it had successfully solved one of the Millennium Prize problems — deep challenges at the frontier of mathematics — by using a group of 10,000 coordinating agents.
-
“How Should the US Prepare for Automated AI R&D?,” IFP (August 2026).
-
Policy tools also exist to address Chinese progress on algorithms and RL environments. However, those are both less well-tested and likely less enduring than tools that address Chinese compute access. More research is needed to formalize and quantify options to slow down Chinese AI capabilities progress beyond compute.
-
As a result, Huawei (China’s leading AI chip designer) does not plan to produce an AI chip matching the best US chip legally available in China (NVIDIA’s H200) until 2027 at the earliest. Even if this timeline holds, it will struggle to produce them at scale if US export controls continue to be strengthened. We estimate China’s severe chip manufacturing bottlenecks mean that will only reach 1–2% of the scale of total US AI chip production in 2026 and 2027.
-
Distillation is a practice where a less capable “student” model is trained on the outputs of a more capable “teacher” model. AI companies routinely make use of the technique to create smaller and cheaper versions of their own models. Adversarial distillation applies the same technique to a competitor’s model, accessed only through its public interface. The distiller collects large volumes of responses from the teacher model, including reasoning traces and multi-step agentic trajectories where these can be extracted, and then fine-tunes its student model on that data.
-
This year, OpenAI and Anthropic have reported adversarial distillation activities from Chinese AI companies DeepSeek, Moonshot AI, and MiniMax. In September, a joint NSA, FBI, and CISA advisory named six Chinese firms (DeepSeek, Moonshot AI, Alibaba, MiniMax, StepFun, and Z.ai) as having extracted “billions of tokens” from models from Anthropic, OpenAI, Google DeepMind, and SpaceXAI since late 2024, concluding that distillation is a core component of these companies’ model development.
-
See Appendix 2 for the full analysis.
-
Range: 662,000 to 1.4 million.
-
Range: 839,000 to 2.1 million.
-
Range: 598,000 to 945,000.
-
Specifically, ASML’s NXT:1980i DUV-i system.
-
See Appendix 3.
-
See Appendix 4.
-
See full analysis in Appendix 4.
-
Range: 674,000 to 1.02 million.
-
Range: 986,000 to 2.04 million.
-
See our prior analysis on this rule, “When Do More AI Chips for China Mean Fewer for the United States?,” IFP (March 2026).
-
We expect another ~80,000 could be sold to additional approved customers like Alibaba and Lenovo, pending Chinese approval. A few additional unnamed Chinese groups could soon receive licenses for similar quantities, according to the Financial Times, but no public shipments have been confirmed.
-
See Appendix 5 for a breakdown of legal import estimates.
-
Based on NVIDIA’s roadmap, the Vera Rubin (NVL72 configuration) will be ~8.8 times more powerful than the H100 on an FP8 basis and ~6.56 times more powerful on a memory bandwidth (TB/s) basis.
-
Range: 381,000 to 2.9 million.
-
Range: 468,000 to 6.65 million.
-
Commercial data from TrendForce, converted to H100-eq, 2026. Estimates of AI chip production excluding Chinese designers, converted to H100-eq (dense FP8): 5.4 million in 2024, 16.0 million in 2025, 45.2 million in 2026, and 125.1 million in 2027.
-
See Appendix 6 for our methodology and results.
-
Between our upper and lower bound, the uncertainty is about how many times bigger the true value might be than the low estimate (or how many times smaller than the high estimate). We thus take the geometric mean as our central estimate, because it is precisely the same number of times bigger than the low estimate as it is smaller than the high one. This keeps the central estimate from being dominated by the high case, which a simple average would do.
-
The largest consumer of overseas AI compute, ByteDance, is a non-public company and thus does not disclose any rentals at all. We size ByteDance via public reporting.
-
Our range is the 10th–90th percentile of a Monte Carlo simulation of the uncertain inputs in our model; see Appendix 7 and Appendix 7a.
-
In the simulation this component ranges from ~237,000 to ~481,000 in 2026 and ~657,000 to ~1.05 million in 2027 (P10 to P90), driven mainly by cluster timing, the ByteDance × Oracle sizing, and unidentified capacity.
-
We do not cover all Chinese-linked sites that may hold GPUs. Chinese-linked developer sites, such as those operated by DayOne or Bridge Data Centres (both key landlords to ByteDance), are outside our cluster-by-cluster scope as we expect SemiAnalysis’s leasing data captures these in Source 2. See Appendix 7.
-
P10 to P90: ~341,000 to ~1.08 million in 2026 and ~1.13 million to ~3.01 million in 2027, driven mainly by the Southeast Asia AI share and the chip mix.
-
SemiAnalysis reports critical IT capacity leased by Chinese hyperscalers grouped by APAC (excluding China), EMEA, and US and Latin America. This counts non-AI data center capacity, e.g., for CPUs and storage, and excludes Western and neocloud-provided capacity (such as by Oracle or Nscale). Per correspondence with SemiAnalysis, the AI share of this capacity broadly covers instances where a Chinese hyperscaler controls the deployment, either by leasing halls directly from developers or renting dedicated hardware via intermediaries such as Megaspeed, which it counts in this data despite Megaspeed sometimes being classified as a neocloud; typically this capacity is off balance sheet. SemiAnalysis does not publicly report its methodology or where exactly it draws the line between what is included versus excluded in its analysis. Our ultimate headline 2026 figure of ~1 million aligns with other 2026 estimates of Chinese remote access using different methodologies.
-
We estimate the AI share of each region’s leases from a separate, forthcoming CTS analysis (Pilz, 2026) of global AI data center buildouts, which tracks the share of AI per added MW of data center capacity per year using regional trade, power, and other data. Applying these shares (weighting them based on when each lease was signed) gives each year’s new leases the AI share of all data center capacity in that region in a given year. This assumes that Chinese hyperscalers’ AI share of leased data center capacity matches global shares. See Appendix 7.
-
This is a mix of around one-third Hopper (H100/H200) and two-thirds Blackwell (B200/B300). Architecture shares are weighted by each GPU’s system-level power.
-
SemiAnalysis indicated that Chinese hyperscalers generally control the hardware in these facilities but keep it off-balance sheet, and reporting shows intermediaries such as Megaspeed renting restricted NVIDIA GPUs to Chinese customers. We convert AI capacity to H100-eq using NVIDIA’s cumulative installed-base mix from Epoch AI (34% H100/H200, 25% B200, 42% B300 by power). For capacity added in 2027, we assume Rubins increase their share at the same pace Blackwells displaced Hoppers, giving ~65% Rubins and ~35% B300s by power. This implies ~416,000 restricted GPUs in these facilities in 2026, against ~86,000–130,000 in documented intermediary fleets. Our lower bound allows for a larger share of older or lower-performance chips. See Appendix 7.
-
Range: 680,000 to 1.5 million.
-
Range: 2 million to 3.9 million.
-
In June, Google reportedly limited Meta’s use of its AI model Gemini, citing insufficient compute.
-
Though supply shortages are the most acute for memory, they are not limited to it. TSMC said in July that its advanced packaging capacity is so tight that it is limiting the growth of US chipmakers like AMD and NVIDIA. Last year, company executives said its advanced logic wafer production capacity was oversubscribed by about three times. TSMC’s advanced 5nm and 3nm nodes were expected to be fully booked with 100% utilization through at least mid-2026.
-
The main exception is for older inventory with no other buyer, such as NVIDIA’s self-reported excess inventory of H200s amid low demand.
-
The tool estimates the US lead using the approach outlined in Appendix 2. We set the frontier training compute ratio to 16x at the end of 2026 (Pilz, 2026, forthcoming), and calibrate the model as described in Appendix 2 (S = 0.5; 10.8 months of lead per 10x of training compute absent distillation). We assume that the training compute ratio moves in proportion to the ratio of total AI compute between the two countries as a result of interventions. China’s compute is the sum of four channels: domestic production, legal imports, smuggling, and remote access (Appendices 4–7). US compute is TrendForce’s cumulative world AI chip shipments (all designers, H100-eq) multiplied by the US share of global AI compute (around 77%), with adjustments for shipment delivery times. This gives about 41.5 million H100-eq in the US at the end of 2026 and 117 million at the end of 2027. The total US-to-China compute ratio would then rise from about 9x to 13x, and the default lead from 6.5 to about 7.4 months. This default increase is shown in the tool. Interventions affecting chip production, legal imports, and smuggling apply only to flows from Q4 2026 onwards. Restrictions on remote access apply to the entire stock. Results should not be interpreted as precise forecasts.
-
See reports from OpenAI (September 2026), Google Cloud (February 2026), and Anthropic (October 2026).
-
See Anthropic’s Threat Intelligence Report (September 2026).
-
For example, Chinese AI company Zhipu reportedly tried to distill the cyber capabilities of Anthropic’s Fable 5 model. After finding that API safeguards blocked these attempts, it switched to the model of another lab. Zhipu’s subsequent model, GLM-5.3, has since been rated by the US Center for Advancing Innovation and Standards for Super Intelligence (CAISSI) as the most proficient Chinese model at cyberattacks ever released.
-
By strengthening its defenses, Anthropic estimates it was able to reduce the amount of data harvested by distillers by 90% to 99%. If specific best practices were widely shared and implemented across US industry, and constantly updated, we assume all frontier AI companies reach roughly this level.
-
See Appendix 2, Section 4 for specific modeling.
-
Other potential routes are a new US-persons control or a new statute (see, for example, the Remote Access Security Act). We exclude these as the first would likely have poor coverage over China’s total AI compute access, and the second requires legislation (we focus here on policy interventions already available to the executive branch).
-
Center for a New American Security (CNAS), “Countering AI Chip Smuggling Has Become a National Security Priority,” June 2025.
-
Epoch AI, “Epoch Capabilities Index,” https://epoch.ai/benchmarks/eci.
-
See Appendix 1.
-
Kaplan et al. (2020) observed that language model loss falls as a power law in training compute across more than seven orders of magnitude. This also applies to benchmark scores. Owen (2024) finds that average benchmark performance is similarly predictable from training compute. Ho et al. (2025) estimate that a general capability index scales linearly with the log of training compute within model families trained with a common recipe. More broadly, frontier training compute has grown exponentially, while frontier ECI scores have risen almost exactly linearly over time (R² = 0.99; Appendix 1).
-
See Appendix 1.
-
According to data from Epoch AI, in 2025 OpenAI allocated roughly 7% of its compute to training runs for released models, and in the same year Chinese AI lab MiniMax allocated roughly 10% (combining these two sources). In that same year, Anthropic allocated 42% of its compute to R&D (which includes training), whereas MiniMax and Z.ai (another Chinese AI lab) allocated 45% and 59%, respectively.
-
We regress the log-odds of each benchmark score on ECI across models in Epoch's benchmark data, giving slopes of 0.202 log-odds per ECI point for AIME (proxied by OTIS Mock AIME), 0.198 for MATH (proxied by MATH Level 5), and 0.115 for GPQA Diamond. We then divide the change in log-odds between two scores by the slope.
-
The capability a model gains from distillation does not scale linearly with the amount of data harvested. Instead, it rises roughly with the logarithm of the data volume. This pattern holds for reasoning distilled from DeepSeek-R1 between 36,000 and 2.2 million samples (AceReason-Nemotron 1.1; see also Yuan et al. 2023 and OpenThoughts). It also holds for agentic coding at similar scales (Skywork-SWE; SWE-smith). As a result, countering distillation requires large cuts in harvested data. Disclosed distillation campaigns against US frontier models range from about 100,000 to 13 million samples per actor. These campaigns focused largely on agentic coding, tool use, and computer use, similar in task type and volume to the studies above. For these capabilities, we estimate that each tenfold change in harvested data shifts about 25% of the capability gained through distillation (range 20–35%). This is based on Skywork-SWE (21–28%) and SWE-smith (~36%), adjusted downward because larger, stronger student models gain less from additional data. Under this assumption, a 90% reduction in harvested data cuts the share of US capabilities recaptured through distillation by about 25%, a 95% reduction by 33%, and a 99% reduction by 50%.
-
Range: 249–294. This figure does not include DUV-i tools installed in multinationally owned fabs operating advanced node production lines in China, which would add an additional 52 DUV-i systems (see Appendix E of CTS’s report).
-
Adding CTS’s figures as of Q1 2026 plus our Q2 - Q4 2026 estimates.
-
This assumption may slightly overstate China’s DUV revenue, since a small portion of China’s net system sales would likely go to Metrology & Inspection (M&I) systems instead of DUV lithography tools each year. M&I sales count for approximately 2–4% of annual system sales between 2021 and 2026. ASML does not separately disclose China’s share of M&I sales in its annual reports or quarterly filings. Assuming China’s M&I share was proportional to its net system sales per year would lower our central ArFi estimate by ~1–3 units per year. For example, if 3% of China’s ~€5.1 billion in forecast H2 2026 net system sales went to M&I rather than DUV, roughly €150 million would be removed from our H2 DUV revenue, lowering our H2 estimate by about one unit (at €83.3 million estimated per unit; see the table notes below). However, this approach could also overstate Chinese M&I share, as ASML’s most advanced M&I tools are principally developed for leading-edge nodes more advanced than China’s 7nm+ nodes. In 2020, for instance, ASML characterized its multibeam inspection system (eScan 1000) as “targeted for 5nm nodes and beyond” (though this may not necessarily exclude system use for larger nodes). Given these uncertainties, and the small impact M&I assumptions would have on our headline 2026 estimate relative to other assumptions (e.g., the concentration of China’s shares in ASML ArFi sales), we exclude M&I shares from our estimates.
-
ASML, Q2 investor presentation, slide 8.
-
ASML, Q2 investor presentation, slide 8. Total DUV revenue (ArFi, ArF dry, KrF, i-line) accounted for 32% of systems sales. Total systems sales were €6.3B.
-
ASML, Q2 investor presentation. China accounted for 19% of all systems sales, which we assume was exclusively DUV systems. Total systems sales were €6.3B.
-
ASML, Q2 investor presentation, slide 8. China accounted for €1.2B of ASML’s system revenue, as per the footnote above. ASML made 9% of its €6.3B in revenue (€0.6B) from non-immersion DUV systems. If China bought all of these systems, it would generate €0.6B of ASML’s revenue for DUV-i systems. This is around 43% of ASML’s global Q1 2026 revenue of €1.4B for DUV-i systems. Applied as a proportion of the 17 unit sales for the quarter yields 7 systems.
-
Assumes the relative proportions of DUV-i sales to China vs. all DUV sales to China are the same as the global average. Applies China’s share of ASML’s global DUV revenue to ASML’s global DUV-i sales.
-
ASML, Q2 investor presentation, slide 8.
-
ASML, Q2 investor presentation, slide 8. Total DUV revenue (ArFi, ArF dry, KrF, i-line) accounted for 40% of systems sales. Total systems sales were €6.6B.
-
ASML, Q2 investor presentation, slide 8. China accounted for 14% of all systems sales, which we assume was exclusively DUV systems. Total systems sales were €6.6B.
-
ASML, Q2 investor presentation, slide 8. China accounted for €0.9B of ASML’s system revenue, as per the footnote above. ASML made 11% of its €6.6B in revenue (€0.7B) from non-immersion DUV systems. If China bought all of these systems, it would generate €0.197B of ASML’s revenue for DUV-i systems. This is around 10% of ASML’s global Q2 2026 revenue of €1.9B for DUV-i systems. Applied as a proportion of the 23 unit sales for the quarter yields 2 systems.
-
Assumes the relative proportions of DUV-i sales to China vs. all DUV sales to China are the same as the global average. Applies ASML’s share of global DUV revenue from China to ASML’s global DUV-i sales.
-
In a Q2 2026 earnings call (July 2026), ASML CFO Roger Dassen stated that ASML expects to ship roughly 130 DUV-i systems in 2026. Subtracting the 45 DUV-i system sales for Q1 and Q2 yields 90 remaining systems.
-
Based on its 2026 interim report (page 18), ASML made €3.3B from DUV-i systems in H1 2026, at a per-unit sales price of €83.3M. Assuming similar pricing in H2 2026, ASML is expected to make €7.5B in revenue from DUV-i systems. In order to compare this with our expected DUV revenue from China in H2 2026, we first need to add non-immersion DUV sales. From the same source, ASML’s non-immersion DUV sales in H1 2026 were €1.3B. We assume this grows to €1.4B in H2 2026, based on ASML’s Q2 2026 earnings call, which states that dry DUV sales have increased over the course of 2026. Adding this to €7.5B yields €8.9B.
-
Forecasted revenue for 2026 is €43B to €45B (ASML, 2026 interim report, page 9). In a Q2 2026 earnings call, ASML CFO Roger Dassen stated that he expects China to “make up around 20% of our total net sales for the full year,” implying an expected €8.8B of revenue from China. Subtracting ASML’s H1 revenue from China — €2.9B (interim report, page 19) — leaves €5.9B for H2. Unlike the Q1 and Q2 revenue numbers, this revenue includes servicing. We estimate 2026 servicing revenue based on applying ASML’s expected 30% annual growth for 2026 to its €8.2B of global servicing revenue in 2025 (ASML, 2025 full-year results, page 7), leading to an estimate of €10.65B. Subtracting H1 2026 global servicing revenue of €5.25B (interim report, page 5) leaves €5.4B in expected global servicing revenue for H2 2026. In H1 2026, China accounted for €2.1B of ASML’s systems revenue (ASML, Q2 investor presentation, slide 8). Subtracting this from ASML’s H1 total revenue for China (€2.9B) leaves €0.8B of servicing revenue from China in H1 2026, 15% of global servicing revenue. Assuming the same share in H2 2026, ASML’s servicing revenue from China is expected to also be €0.8B. Subtracting this from forecasted total revenue for China for H2 2026 (€5.9B) yields €5.1B.
-
As per the two footnotes above, ASML’s non-immersion DUV revenue in H2 2026 will be €1.4B, and revenue from China for all DUV systems will be €5.1B. If we assume China buys all of ASML’s non-immersion DUV systems in H2 2026, that leaves €3.7B for DUV-i systems, around 50% of the €7.5B global total. €3.7B/€7.5B × 90 units = 44 full DUV-i systems to China.
-
Assumes the relative proportions of DUV-i sales to China vs. all DUV sales to China are the same as the global average. Applies ASML’s share of global DUV revenue from China to ASML’s global DUV-i sales.
-
Midpoint of annual floor and ceiling ((54+70)/2). Period midpoints are rounded down, which is why they sum to 61.
-
For the Ascend 910C, which does not support dense FP8 operations, we instead use the 910C’s INT8 performance to calculate H100-eq. The overall difference is small — using our method, the 910C is 0.76 rather than 0.79.
-
Huawei: domestic HBM, foreign HBM stockpile, and smuggled HBM volumes are from Epoch AI’s memory-constrained model of Huawei Ascend production (Epoch AI). Domestic HBM from CXMT and XMC equips 144 GB Ascend 950DTs. The Samsung HBM2E stockpile left over at the end of 2025 equips Ascend 910Cs; this includes stockpile that was not needed in 2025 because HBM smuggled that year was used instead. HBM smuggled in March–May 2026, inferred from excess revenue at a Taiwanese distributor, equips additional 950DTs. Ranges are Epoch’s 90% Monte Carlo intervals. Ascend 950PR (non-HBM memory): Huawei reportedly planned to ship about 750,000 in 2026 (Reuters, March 2026); we use 500,000 (range 250,000–750,000) to reflect SMIC capacity constraints and consistency with TrendForce’s 2026 sales estimate. Cambricon: Epoch AI’s estimate of about 95,700 Siyuan 590s sold in H1 2026 (Epoch AI), with H2 output assumed at 1.25x H1 as in 2025 (low: H2 equal to H1; high: Cambricon’s reported 300,000-unit flagship target, per Bloomberg). Other Chinese designers: IDC’s H1 2026 shares for T-Head (7%), Kunlunxin (4%), and Hygon (3%) of China’s 2.0 million accelerator shipments (Reuters via The Edge), plus an assumed 100,000 units in H1 2026 from smaller designers (MetaX, Moore Threads, Enflame, Biren, Iluvatar CoreX), scaled to a full year at 2.2x H1 consistent with IDC’s 2025 figures, which imply roughly 220,000 units a year from designers beyond Huawei, T-Head, Kunlunxin, Cambricon, and Hygon.
-
We convert units to H100-equivalents (H100-eq) using dense 8-bit throughput relative to the H100’s 1,979 dense FP8 TFLOP/s: Ascend 950DT and 950PR 0.505 (1 PFLOP/s dense FP8), Ascend 910C 0.76 (1,504 TOPS dense INT8; the 910C does not support FP8), Cambricon Siyuan 590 0.259 (512 TOPS dense INT8, per Epoch AI). For other Chinese designers, whose chips mostly deliver 100–350 TFLOP/s of dense FP16, we follow an approach based on TrendForce data and add 30% (range 15–60%) to Huawei and Cambricon compute, using IDC unit shares and company filings. We apply this multiplier on a basis that values the 910C by FP16 throughput (0.39 H100-eq), so that our higher INT8-based 910C value does not inflate the estimate. On a common basis, our 2026 total (about 985,000 H100-eq) is within about 10% of an independent estimate derived from TrendForce data.
-
Huawei domestic HBM: Epoch AI’s model, with the 144 GB Ascend 950DT and 288 GB Ascend 960DT (launched Q1 2027) splitting usable HBM 40/60 (range 20–60% for the 950DT), giving roughly 57% 950DTs and 43% 960DTs by unit (Epoch AI). The pre-2026 HBM stockpile is assumed fully used in 2026. Smuggled HBM (speculative): we assume smuggling scales with domestic HBM production, keeping its 2026 ratio (about one-third) and chip mix; the range combines uncertainty in the 2026 smuggling estimate and in domestic growth. Ascend 950PR and Cambricon (speculative): we assume output is constrained by SMIC’s advanced-node good-die output, which grows about 1.7x from SemiAnalysis’s capacity projection (60,000 to 80,000 wafers per month) and Goldman Sachs’s yield projection (23% in 2026 rising toward 50% by 2030), with each keeping its 2026 share of SMIC output. The 950PR range (about 390,000–1.6 million) reflects uncertainty in the 2026 base, capacity growth (none to a doubling), and yield. Other Chinese designers: scaled with their compute estimate (see H100-equivalents, 2027).
-
Conversions as for 2026, plus the Ascend 960DT at 1.01 H100-eq (4 PFLOP/s FP4, converted at half that for an FP8 equivalent). Because the 960DT carries twice the HBM of the 950DT for twice the compute, the 950DT/960DT split affects unit counts but not total compute. Cambricon is valued at Siyuan 590 throughput; if the newer Siyuan 690 ramps as reported, Cambricon’s 2027 compute could be roughly twice our estimate. Other Chinese designers are again 30% (range 15–60%) of Huawei and Cambricon compute. Ranges are shown per channel and are not additive.
-
Under US export controls, non-data center chips with a total processing performance (TPP) below 4,800 are exempt from ECCN 3A090 (Federal Register). The RTX 5090’s 838 TFLOP/s of dense FP8 implies a TPP of about 6,700, above this threshold. NVIDIA cut the RTX 5090D’s AI throughput to about 4,750 TPP to stay below it (Tom’s Hardware), and later released a 24 GB RTX 5090D V2 with lower memory bandwidth (Tom’s Hardware). Full RTX 5090s in China would have been smuggled rather than legally imported.
-
On the RTX Pro 6000D, see TrendForce, reporting the FT’s account of the Cyberspace Administration of China’s instruction. On the RTX 5090D V2, see Asia Times, also citing the FT. The FT’s October 2026 report lists the RTX Pro 6000D among the most-purchased cards, so we do not exclude it.
-
TPP is 2 × MacTOPS × bit length, which equals dense 8-bit TFLOP/s × 8 (Federal Register). A TPP of 4,800 therefore corresponds to 600 dense FP8 TFLOP/s, or 0.303 of the H100’s 1,979.
-
As of May 2026, 10 Chinese companies had been approved to buy H200s, including ByteDance, Tencent, Alibaba, JD, Foxconn, and Lenovo, each capped at 75,000 chips, so these approvals alone permit up to 750,000 H200s. In July, Reuters reported licenses for three additional entities: ZTE Kangxun Telecom, a Kingsoft Cloud subsidiary, and Maginfra. Not all of the initial 10 approved customers have been named, so these three may already be among them. If they are additional, approvals would permit up to 975,000 H200s (13 × 75,000). Our high case assumes approved buyers purchase up to these caps across 2026 and 2027, so 2027 shipments are at most 975,000 less our central 2026 estimate of 100,000, or 875,000.
-
Figures are quoted on a dense FP8 basis unless otherwise noted. Tables also show H100-eq on a memory-bandwidth basis (TB/s), which better reflects inference capacity. See the final section of this appendix for our assumptions, inputs, and conversion factors. In our central estimate and in the simulation, capacity added in 2027 follows a Rubin sales ramp (see “Modeling the Vera Rubin ramp”). Rubin GPUs deliver ~3.5x the B300’s dense FP8 throughput and ~8.8x the H100’s, per NVIDIA’s roadmap. We exclude the VR NVL144 Ultra, which is not expected to ship at scale until 2027 or 2028.
-
“Low” and “High” are the 10th and 90th percentiles of a Monte Carlo simulation in which each uncertain input in this appendix — the regional AI shares, the chip mix behind leased capacity, energization, SemiAnalysis’s 2027 forecast, the sizing of the ByteDance × Oracle and Tencent × Oracle clusters, the timing and scope of other clusters, and unidentified capacity — is drawn from a stated range and the model is re-run 200,000 times. The inputs and ranges are outlined in the methodology supplement. The central estimate uses our best-guess value for every input and sits at the median of the simulation on a dense FP8 basis (51st percentile in 2026, 54th in 2027), and below it on a memory-bandwidth basis (39th and 48th), because H20-class chips count for little on dense FP8 but nearly as much as an H100 on memory bandwidth.
-
“Central estimate” in 2026 adds the floor clusters outside SemiAnalysis’s scope (Source 1) to SemiAnalysis’s leasing data (Source 2). For the leasing data, we assume all leased capacity is operational, weight AI shares by when leases were signed, and convert AI capacity at NVIDIA’s installed-base Hopper/Blackwell mix. In 2027, it carries the 2026 floor clusters, adds new clusters expected online, and converts AI capacity added in 2027 at a mix of Blackwells and Rubins. Every input is set to its central value; the simulation varies them around these values.
-
For example, we analyze neocloud Datasection’s public filings to re-estimate clusters believed to serve Tencent and add a 100,000-GPU Tencent x Oracle leasing agreement announced after publication. See our cluster sheet for estimations, sourcing, and notes.
-
In particular, the contracts for Chinese access to US cloud providers may have changed or terminated since Reuters reported the Chinese tenders over two years ago (August 2024). We still include them as presumed active clusters, as it is likely the equivalent capacity is still available to Chinese entities — if not more. We do not model US cloud access beyond these tenders, nor do we systematically cover small-scale access by Chinese entities like research institutions, which makes up the majority of the tenders reported by Reuters. As a result, there is a long tail of 1–120 MW of AI capacity in 2026 and 2–250 MW in 2027 (90% ranges; typical values of about 11 MW and 22 MW). We keep these roughly 9,000 A100s as a floor for a whole portion of Chinese compute access where we likely undercount.
-
SemiAnalysis’s figures count capacity Chinese hyperscalers lease from landlords or rent from non-Western, non-neocloud providers such as Megaspeed (per October 2026 conversations with SemiAnalysis). They exclude GPUs rented from Western clouds and neoclouds.
-
We place this in the 2027 floor, assuming 80% operation for full fleet by year-end. See our sheet for product mix assumptions and other inputs.
-
73 MW in service (assumed critical IT) and 47 MW under construction as of September 20, 2026. The AI evidence is generic. The 2024 launch release cited rising AI workloads and promised liquid cooling “to enhance energy efficiency.” No tenant is named. We assume 100% of the active facility is for AI and uses B200 GPUs.
-
Phase 1 is 200 MW of IT capacity, but operation only starts around July 2027 and ramps through 2029, so only a fraction is live by year-end. We size this cluster by assuming the first building (50 MW) is active by year-end and that it serves 100% AI workloads (including TikTok) on B300s, as an illustration. It will reportedly be owned by a ByteDance subsidiary, theoretically requiring a license for advanced GPU purchases. We assume ByteDance could do a financing structure that allows restricted GPU access.
-
See SemiAnalysis’s chart in “The Chinese AI Infrastructure Boom,” September 2026. Note that the chart is paywalled. We split Asia-Pacific ex-China 80/20 between Southeast Asia and the rest of Asia-Pacific. Southeast Asia includes Singapore, Malaysia, Indonesia, Thailand, Vietnam, the Philippines, Cambodia, Laos, Myanmar, Brunei, and Papua New Guinea. The rest of Asia-Pacific includes Japan, South Korea, Taiwan, and Australia; Hong Kong and Macau count as China.
-
Signed leases routinely run ahead of usable capacity: Datasection’s Tencent clusters in Japan and Australia were contracted for operation from February and July 2026 but had not started full-scale operations by October (see sheet). As a sensitivity, if only 80% (range 70–90%) of leases signed during each year were operational by year-end, with earlier leases fully operational, our central estimate would fall to ~973,000 H100-eq in 2026 and ~2.63 million in 2027. In the simulation, the share of each year’s new leases operational by year-end is drawn from a 65–100% range with a most likely value of 100% and a downside tail only.
-
For example, SemiAnalysis reported in January 2025 that ByteDance was leasing Malaysian capacity to deploy CPUs and “some unrestricted GPUs like the B20 and H20,” while renting state-of-the-art GPU systems from Oracle.
-
Confirmed in correspondence with SemiAnalysis.
-
The shares come from a separate analysis, available on request and to be published in forthcoming work (Pilz, 2026). For each year from 2023 to 2026, AI capacity added in each region outside China is estimated as total data-center IT capacity brought online (in MW of critical IT load, with reported facility power converted using a power usage effectiveness ratio) multiplied by the share of those additions serving AI workloads. The AI share is built up from named AI deployments, operator and tenant disclosures, and Epoch AI’s chip-trade data. Capacity figures draw on data from FERC, SemiAnalysis, EUDCA, Knight Frank, CBRE, Cushman & Wakefield, and DC Byte. Each region then receives a share of that year’s non-China AI chip production in proportion to its share of new AI capacity. Chips are counted where they operate, not by owner headquarters. All shares are region-wide. EMEA weights Europe and the Middle East, and US + Latin America weights the US and Latin America, by each year’s capacity added; for 2026 this gives 56.4% and 83.7%.
-
If Chinese hyperscalers favored AI capacity more heavily than the wider market, for instance, to access GPUs they cannot buy at home, our estimate would be too low. If more of their leasing went to CPUs and storage for consumer apps like TikTok, it would be too high.
-
See SemiAnalysis’s chart.
-
TikTok workloads count as AI inference, but the capacity running these workloads at this time likely used CPUs and older GPUs that would convert to far fewer H100-eq than our 2026 chip mix. Chinese-headquartered companies would also need a license to retrofit facilities with export-controlled GPUs.
-
Equal to 100% in the central estimate; the simulation draws it from 65–100%.
-
Assumed AI capacity for Chinese customers. We vary Oracle’s SJB capacity (300–400 MW), ByteDance’s share (55–85%), its AI share (55–90%), energization (70–100%), possible Hopper share, and a 0–50% overlap with SemiAnalysis data in our Monte Carlo simulation.
-
Each MW of fully AI cluster capacity reduces As by (1 − R) MW.
-
AI share of all data center capacity added in the region in year t (P50).
-
Historically weighted regional AI share of data center capacity.
-
Adjusted for identified clusters outside SemiAnalysis’s scope. Southeast Asia: ByteDance x Oracle SJB, Aolani, INF Tech and the unnamed lab. EMEA: Nscale. Rest of Asia-Pacific and US + Latin America: none, so AdjS = R_T
-
2026 clusters carried forward (assumed still active), plus 2027 additions: Tencent x Oracle and Aolani’s expanded cluster in Southeast Asia, and Tencent x Datasection (Chiba, Japan and Sydney, Australia) in the rest of Asia-Pacific. US + Latin America: none.
-
SemiAnalysis reports Asia-Pacific ex-China as a single region covering Japan, South Korea, and Australia, as well as Southeast Asia. We assign 80% of APAC capacity to Southeast Asia and 20% to the rest of Asia-Pacific, as SemiAnalysis places most of Chinese hyperscalers’ 2024–2026 lease additions in the Singapore/Johor/Batam (SJB) region. SemiAnalysis does not publish a country breakdown of its leasing data (making this an assumption), but the split is broadly supported: Johor, Malaysia, is believed to be the second-largest AI hub in the world. ByteDance’s 700–800 MW of IT capacity in SJB by year-end 2026 is about half of its total 2026 Chinese hyperscaler APAC overseas data center leasing (1,460 MW), even before accounting for Tencent or Alibaba leases in the region. Shifting the Southeast Asia/Rest of APAC split by 10 percentage points on either side (i.e., 70/30 or 90/10) would change our 2026 estimate by ±30 MW of AI capacity, or our headline estimate by only ~31,000 H100-eq. Our simulation varies the split between 70/30 and 90/10.
-
For the rest of Asia-Pacific, we use the 2026 AI share for Japan, South Korea, and Taiwan (35% P50) rather than a capacity-weighted average that includes India (52%), which would raise our share to roughly 45%. We do this because we believe Chinese hyperscalers have little presence in India — India banned TikTok and other Chinese apps starting in June 2020, and Alibaba Cloud closed its data centers in Mumbai in 2024, saying it would redirect investment to Southeast Asia and Mexico. By contrast, Chinese hyperscalers’ remaining APAC capacity is noticeably concentrated in Japan and South Korea. Alibaba is expanding AI operations in South Korea and Tencent has three facilities in Japan. Including India on a weighted basis would raise our estimate by roughly 23,000 H100-eq in 2026 and 68,000 in 2027.
-
SemiAnalysis’s data is read from its chart, which does not label values, making our baseline MW values approximate.
-
Since November 2023, US rules have required a license, reviewed under a presumption of denial, for advanced chips destined for entities headquartered in China or Macau wherever they are located; BIS reaffirmed this in 2026. Renting from a non-Chinese owner can fall outside this requirement, but arrangements in which the Chinese tenant controls the hall are under enforcement scrutiny, as the Megaspeed case shows. Our scenarios imply no legal judgment. They also imply ~416,000 restricted GPUs in these facilities in 2026, against ~86,000–139,500 in documented intermediary fleets (lower range is Megaspeed’s 86,000 audited GPUs, assumed still outside China; higher end includes Novagate Sovereign AI’s claimed ~50,000 GPUs, and Siam AI’s ~3,520 GPUs; see sheet). It is plausible that sufficient intermediary capacity exists to meet this ~3–5x gap in implied compute, given that this observed fleet is based on one-off media reports alone. In the simulation this ranges from roughly 245,000 to 680,000 GPUs (P10–P90). The count can exceed the central figure at a similar MW because H20 chips draw less power each. We do not model any Chinese domestic chips within this capacity.
-
We convert all 2026 capacity using NVIDIA’s cumulative installed-base mix (34% Hopper and 66% Blackwell by power), rather than the mix of chips sold when each lease was signed. Most of SemiAnalysis’s Asia-Pacific leases were signed in 2025–2026, when Blackwells made up ~80% of NVIDIA’s Hopper and Blackwell unit sales in 2025 and nearly all in 2026 (see final section of this appendix). A mix matched to each lease’s vintage would be closer to ~25% Hopper and ~75% Blackwell for Southeast Asia, giving ~4% more H100-eq per MW, or ~20,000 H100-eq more in 2026. We keep the installed-base mix, noting this as a sensitivity for our Southeast Asia and APAC figures.
-
AI shares applied and adjusted for leasing period and additional clusters outside SemiAnalysis’s scope, Hopper/Blackwell power-weighted mix.
-
The Tencent × Oracle agreement is reportedly worth ~$7 billion over five years for ~100,000 GPUs, or ~$1.4 billion a year, which implies ~$1.60 per GPU-hour ($1.4B/100,000 GPUs/8,760 hours per year). The H100-eq that one such agreement (100,000 GPUs for five years) buys depends on the chips it covers, which have not been disclosed. We size it in our cluster analysis as a mix of Blackwells and Rubins. Theoretically, if all are Hoppers (unlikely), one agreement provides ~100,000 H100-eq, and our estimate would require the equivalent of ~10.5 agreements of this size (1.054M/100,000), funded by all Chinese entities leasing overseas (~$74 billion in total contract value, or ~$14.8 billion a year; 1.054M/100,000 =~10.5; 10.5 × $7B = ~$74B; 10.5 × $1.4B = ~$14.8B). At our 2026 installed-base mix by units (42% H100/H200 and 58% Blackwells), one agreement provides ~188,000 H100-eq (100,000 × [0.42 × 1.0 + 0.58 × 2.53]), requiring ~5.6 Tencent × Oracle-scale agreements at ~$7.8 billion per year (1.054M/188,000 = ~5.6 agreements; 5.6 × $1.4B = ~$7.8B). If all are Blackwells, one agreement provides ~253,000 H100-eq, requiring ~4.2 Tencent × Oracle agreements to meet our estimates, or $5.8 billion per year (1.054M/253,000 = ~4.2 agreements; 4.2 × $1.4B = $5.8B). Furthermore, Datasection’s 2025 contract with the customer the FT identifies as Tencent implies $3.09 per B200-hour (see our sheet for calculations), or ~$1.22 per H100-eq hour ($3.09/2.53 B200 ratio). At that rate, our estimate would cost ~$11.3 billion per year (1.054M × 8,760 hours × $1.22). This is roughly compatible with hyperscale overseas rental spending we can observe. For instance, ByteDance reportedly planned to spend ~$7 billion in overseas NVIDIA renting in 2025. If its 2026 overseas budget at least matched that, it could alone cover the full cost (~120%) of our estimate at all-Blackwell pricing ($7B/$5.8B), ~90% of our installed-base mix ($7B/$7.8B), and ~62% at Datasection’s rate ($7B/$11.3B). This analysis is highly price sensitive.
-
Inclusive of Western and neocloud rentals.
-
Including 2026 delayed or unconfirmed clusters (Tencent × Datasection; Aolani × ByteDance expanded cluster), which we assume become operational by year-end 2027. The simulation gives the Aolani expansion an 85% chance and the Datasection sites a 90% chance of being operational by year-end 2027, and varies the Tencent × Oracle cluster’s operational share (60–100%) and Rubin share. This figure also includes the Tencent × Oracle cluster (assumed 80% operational by year-end) and carries our 2026 floor clusters, assuming they are still serving Chinese customers.
-
We lack 2027 regional AI shares, so we apply each region’s 2026 share to 2027 additions. AI shares could rise if more GPUs are deployed relative to added capacity. The simulation applies the same regional shock to the 2027 additions as to the 2026 vintage, and varies SemiAnalysis’s 2027 forecast by ±15%.
-
We assume that Rubin sales follow the same ramp as the historical transition from Hopper to Blackwells, and that Rubins become available to lessees as of Q1 2027 (see inputs and conversions section below). We apply the mean of the four-quarter ramp to SemiAnalysis’s data, yielding approximately 65% Rubins and 35% Blackwells (assumed B300s) once adjusted for each architecture’s power. We assign 2027 added capacity to the chips in these shares.
-
IAPS’s estimates are quoted in H100-eq on a TPP basis.
-
The B300 is equivalent to the B200 on a dense FP8 basis; where it really shines is on FP4, where the B300 equals 1.5x the B200.
-
On memory bandwidth: SemiAnalysis notes that the Rubin’s actual memory bandwidth may fall below target to 20 TB/s as HBM4 suppliers struggle to meet demand. If so, this would yield an H100-eq conversion factor of 5.97x.
-
No system power is published for an 8-GPU HGX H20 server, so we assume it shares the HGX H200’s per-slot non-GPU draw of 575 W (the H200’s 1,275 W per-GPU system power minus its 700 W TDP). Adding the H20’s 400 W TDP gives 975 W per GPU, or 7.8 kW per server. We do not scale the full H200 system by the ratio of the two TDPs instead, as CPU, memory, and networking draw does not fall with GPU power; doing so would falsely imply ~34% more H20s per MW.
-
We assume the Max-Q configuration (180 kW per rack, or 2,500 W per GPU at system level), which has a higher performance-per-watt than the Max-P (220 kW, or ~3,056 W per GPU). SemiAnalysis gives GPU-level power of 1,800 W for Max-Q and 2,300 W for Max-P. It publishes throughput only for the Max-P (17,500 dense FP8 TFLOP/s); we apply this to both, which marginally overstates the Max-Q.
-
For H100s, SemiAnalysis estimates that networking switches, storage servers, CPU nodes, transceivers, and other equipment add roughly 10% to total IT power beyond the GPU servers in a 100,000-GPU cluster. NVIDIA’s itemized component-level power budget for a 127-node, 1,016-GPU DGX H100 SuperPOD implies a similar 11% (Table 4 in the PDF download shows 1,295,400 watts for the DGX system; additional storage, management servers, fabric managers, etc., add 146,720 watts, or 11%, for a total cluster size of 1,442,120 watts). We divide H100 and H200 power capacity figures by 1.10 to round. For Blackwell systems, Epoch AI estimates that non-server IT equipment adds 14% to server power, based on NVIDIA’s DGX GB200 SuperPOD. We apply this figure to GB200 and GB300 figures, noting this factor is sensitive to the assumed rack power and may differ between GB200 and GB300 NVL72 configurations.
-
We use the quarterly cumulative mix rather than chip sales mix for sizing existing facilities to reflect installed GPUs accumulated over several years. A quarterly sales mix skews much more heavily toward Blackwells: for example, renormalizing average H100/H200 and Blackwell sales for H1 2026 yields <1% H100/H200s, ~20% B200s, and ~79% B300s. If cloud providers or hyperscalers decided to update existing GPUs with the newest architectures at a faster rate than our cumulative mix assumes, our estimates would undercount total H100-eq. For facilities not yet complete at the time of writing, we use sales rather than cumulative shares, as these facilities have no installed hardware yet.
-
Applying H100-eq shares directly to power capacity, for instance, gives too much power to Blackwells, which give more H100-eq per watt than Hoppers, and would overstate cluster sizes by ~5–10%.
-
Some clusters that we expect to come online in 2027 use a Blackwell-only mix, per reporting. We flag these in the analysis where relevant.
-
We derive quarterly unit sales by finding the change in Epoch’s quarterly unit shipments for the H100/H200, B200, and B300 between Q3 2024 and Q1 2026. The ramp quarters are relative to the first quarter of Rubin shipments (Q1 2027 in our slower ramp, Q4 2026 in our faster ramp), and are not tied to an official calendar year date. The ramp assumes that Rubin displaces Blackwell as quickly as Blackwell displaced the H100/H200. Delays in shipments after our assumed start could slow the Rubin transition and lower overall H100-eq estimates.
-
Equal to Blackwell’s share of Hopper and Blackwell unit sales in the corresponding quarter after Blackwell’s launch (Epoch AI).
-
A Rubin GPU draws about 2,500 watts at a Max-Q system level, compared to the B300's 1,972 watts. To find the Rubin share of power, we multiply the unit share "s" by 2,500 watts, divided by the total: s*2,500 / [s*2,500+(1-s)*1,972].